Overview
A genomic constraint metric is now available on the gnomAD browser. We quantify the depletion of variation (constraint) at a 1kb scale with a signed Z score by comparing the observed variation to an expectation. In each tiling 1kb genomic region, the expected number of variants is predicted using an improved mutational model that takes into account both local sequence context and a variety of genomic features. A higher positive Z score (i.e., observing fewer variants than expected) indicates higher constraint. To learn more about the genomic constraint metric, what it means, and how it was calculated, view the full preprint on bioRxiv.
This metric was calculated for the GRCh38 build of the human genome, and is available for the gnomAD dataset version 3.1.2 on both the Variant and Region pages. The Z score ranges from -10 to 10. Z >= 2.18 (yellow) and Z >= 4.0 (red) represent the top 10% and top 1% of constrained non-coding regions, respectively.
-
See the genomic constraint track for a given region
Location of the Genomic Constraint Track on the Region Page 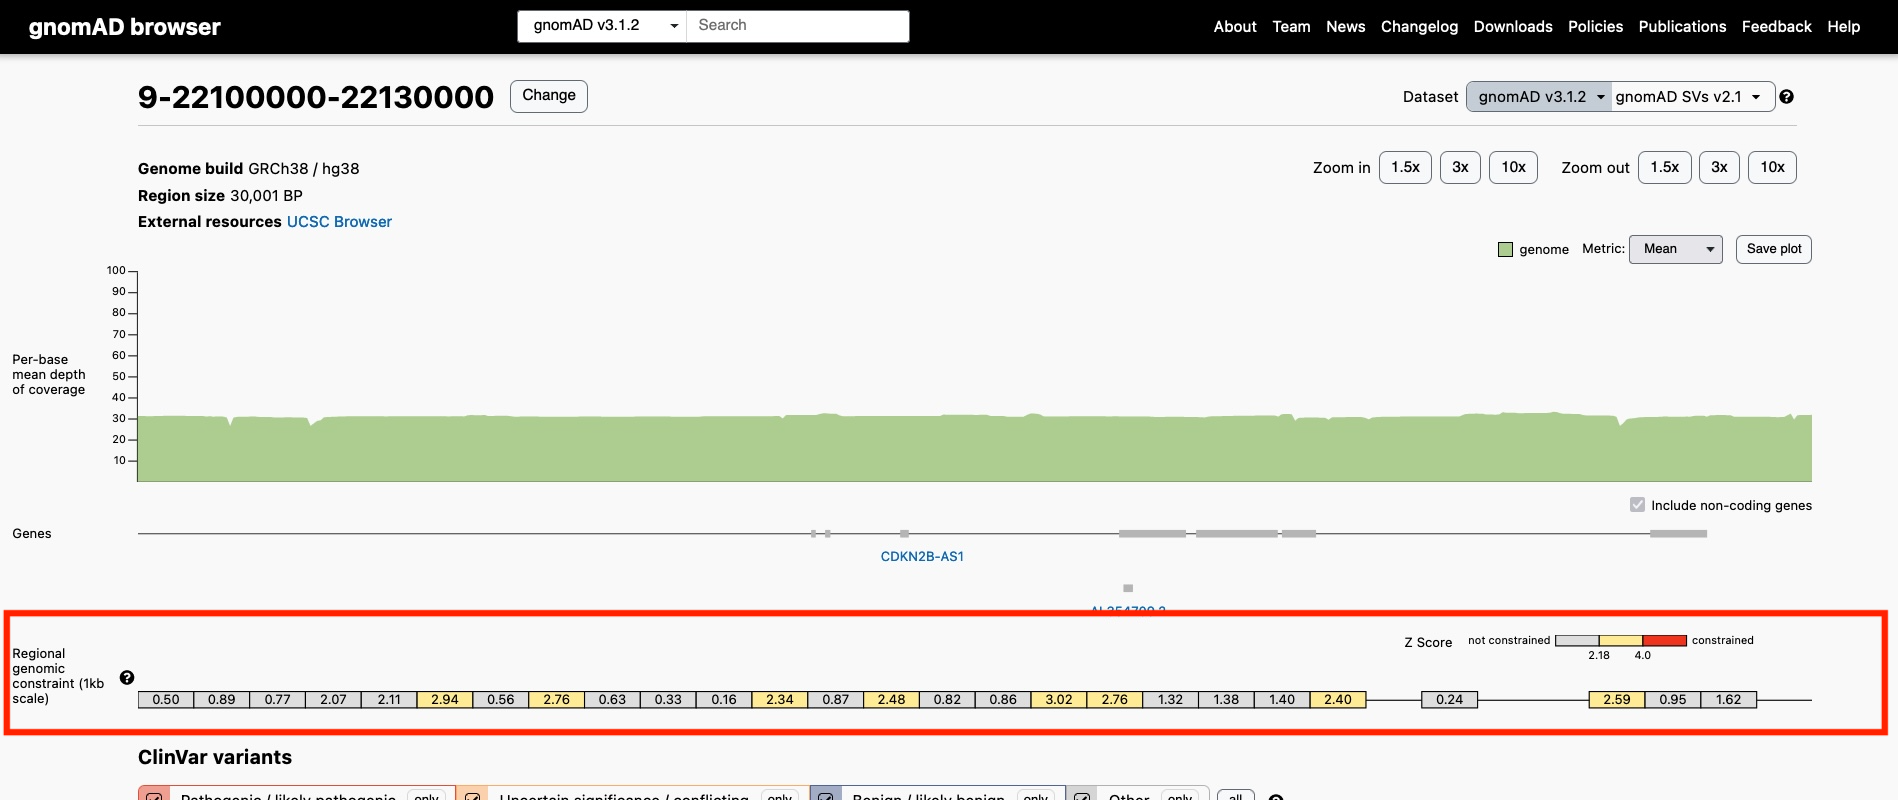
Closer View of a Portion of the Genomic Constraint Track 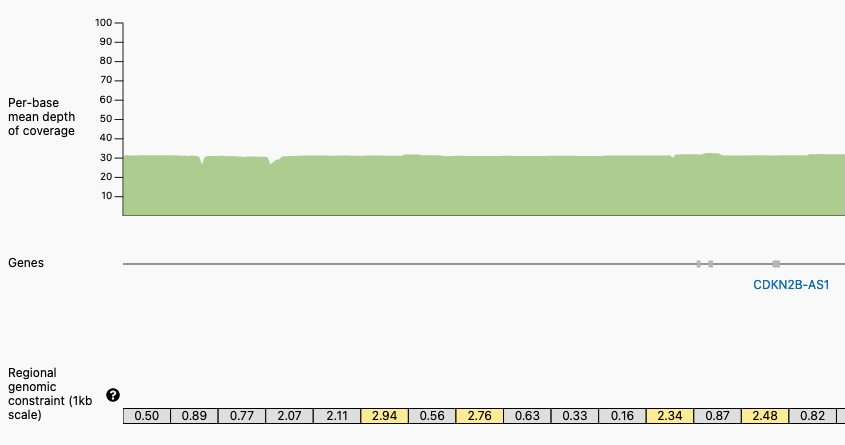
-
See the genomic constraint table for the 1kb region surrounding a specified variant
The Genomic Constraint Table on the Variant Page 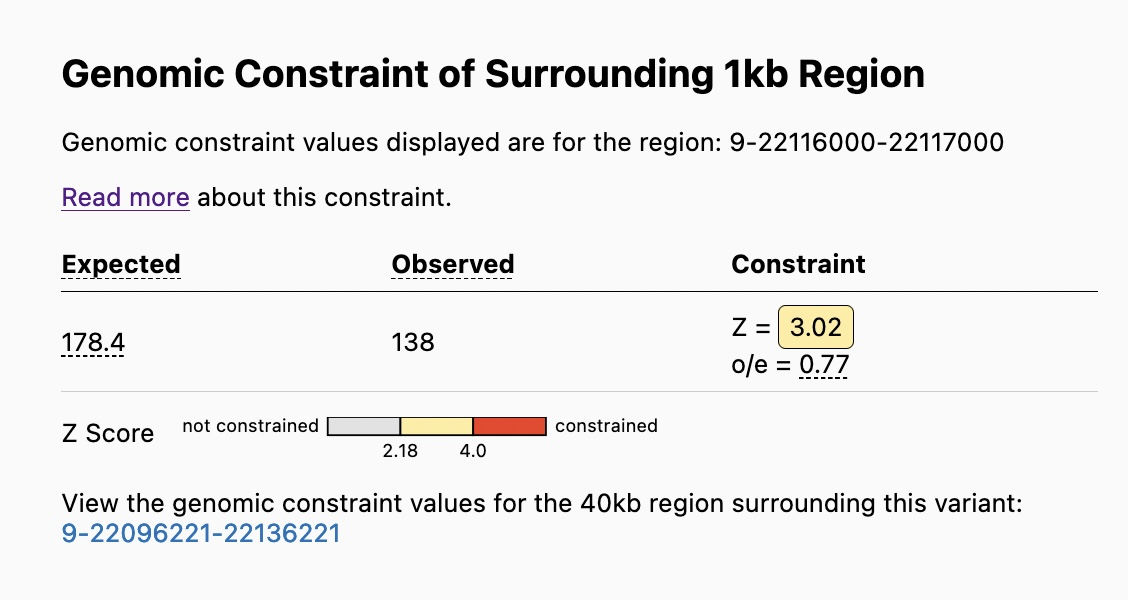
-
Click the region linked below a variant’s constraint table to see the genomic constraint track with the variant location shown for the 40kb region surrounding it
A Portion of the Genomic Constraint Track with a Selected Variant 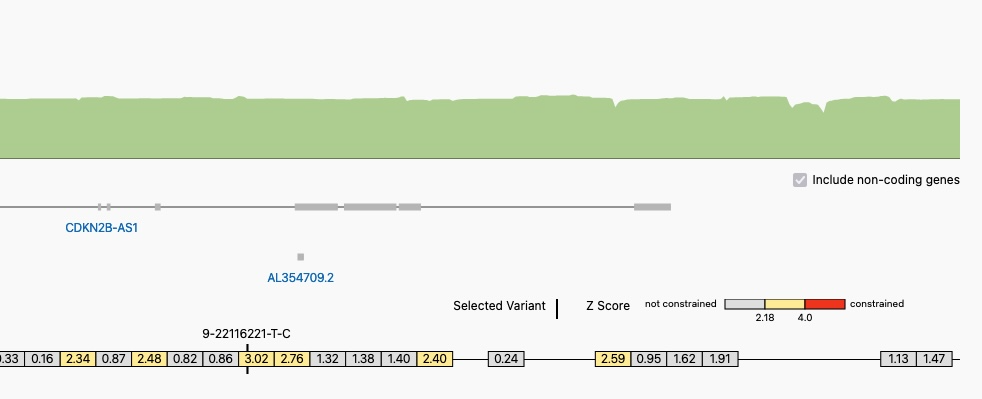
All the data is also available for download.