Today, we released gnomAD v4.1.1, which includes an update to our gene constraint metrics, LOFTEE flags, and a minor update to other flags and annotations. In this blog post, we discuss the improvements incorporated in this release, our new LOEUF threshold recommendations, and guidance around interpretation of the gene constraint metrics.
Improvements in v4.1.1
We have released updated gene constraint metrics calculated on the gnomAD v4.1 exomes as part of this release. There are three important updates to the constraint metrics calculations between v4.0 and this release: expanded the metrics calculations to include all coding loci, including chromosomes X and Y, revised the behavior of LOFTEE’s END_TRUNC flag, and updated the calculation underlying the loss-of-function observed / expected upper bound fraction (LOEUF) metric.
In addition to updating gene constraint metrics, we have updated the GA4GH VRS IDs to v2.0 in our downloads files, added two new flags to the gene and transcript pages, and have included a minor variant annotation update.
Expansion of constraint metrics to include low coverage bases
Starting in gnomAD v3.0, we transitioned from calculating sample coverage from read data to genotype data due to cost constraints. However, coverage calculated from sample genomic VCFs (gVCF) is not as granular as coverage information from read data due to the reference block structure within gVCFs. As a result, the gnomAD v4.0 gene constraint metrics were only computed across higher confidence, well-covered (median exome depth ≥ 30) coding loci.
In order to include lower coverage coding loci in the constraint calculations, we switched to using allele number (AN) as a proxy for coverage. We defined high coverage sites as those with an AN percent ≥ 90% in the gnomAD exome samples. For sites with exome AN percent between 20% and 90%, we built a coverage model — a linear regression on synonymous sites relating AN percent to the proportion of observed variation — and used it to adjust the proportion of expected variation. Sites with exome AN percent < 20% (0.58% of all possible synonymous sites) were excluded from analysis.
Constraint metrics for sex chromosomes
As part of the gnomAD v4.1.1 minor release, we have now included constraint metrics for chromosomes X and Y. Methylation data for these chromosomes were unavailable at the time of the v4.0 release. We have since computed methylation metrics for both chromosomes and have released the complete set of methylation data.
LOFTEE flag update
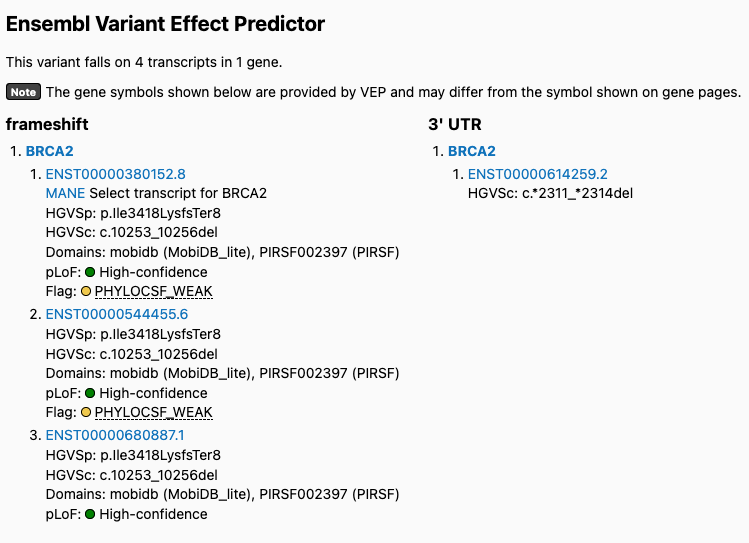
LOFTEE’s END_TRUNC flags predicted loss-of-function (pLoF) variants near the ends of transcripts that do not trigger nonsense mediated decay using the 50 base pair rule1 and their GERP (Genomic Evolutionary Rate Profiling)2 distance. Several users reported unusual behavior with this END_TRUNC flag in human genome reference build GRCh38 due to the GERP distance threshold for this flag (set to -58.0). Users noticed that pLoF variants in genes that were previously flagged as being low confidence in gnomAD v2 were marked as high confidence in gnomAD v4. For example, this pLoF variant in v2 was flagged using the END_TRUNC flag but is marked high confidence in v4:
v2:

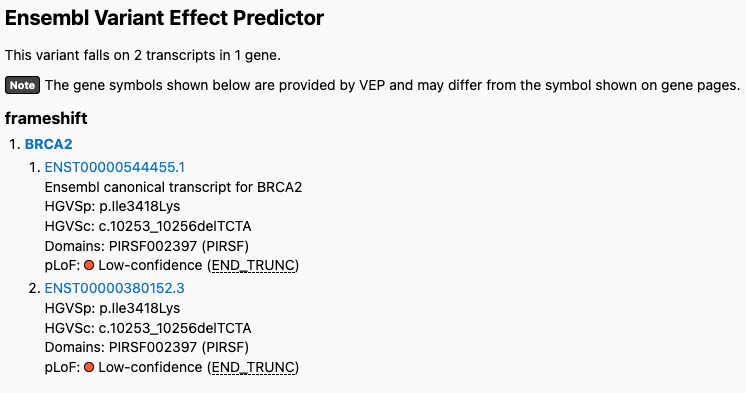
v4:

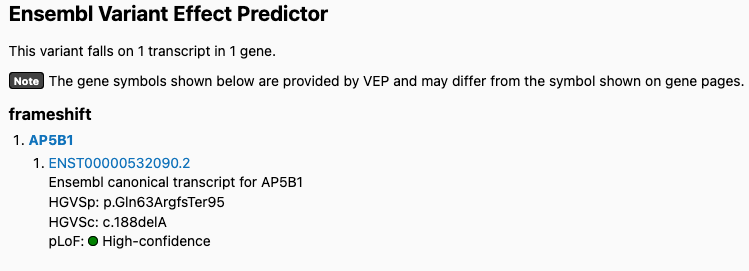
Users also reported variants being inappropriately flagged in v4. For example, this variant is flagged as low confidence in v4 but is high confidence in v2:
v4:

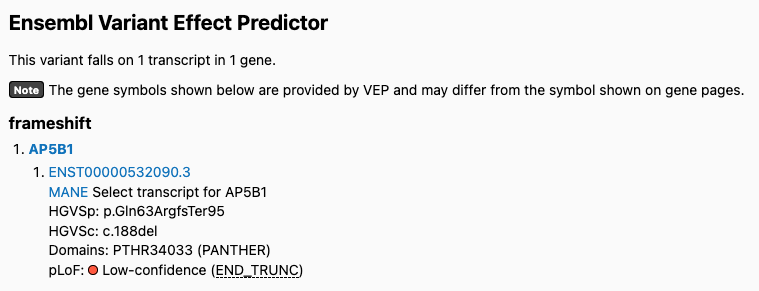
v2:

To address this issue, we have updated the GERP distance threshold to 0.0 and re-annotated LOFTEE in gnomAD v4.1.1. GERP distances measure evolutionary constraint, with positive values indicating conservation and negative values indicating less constraint. Terminal truncations towards the ends of transcripts do not have large negative GERP distance values, as they are not deleting a large number of bases, which meant they were not correctly being flagged with the previous threshold value (-58.0). Changing the GERP distance threshold to 0.0 updates the behavior of this flag to indicate that terminal truncations with negative GERP scores (i.e., variants that delete less evolutionarily constrained bases) are low-confidence pLoFs.
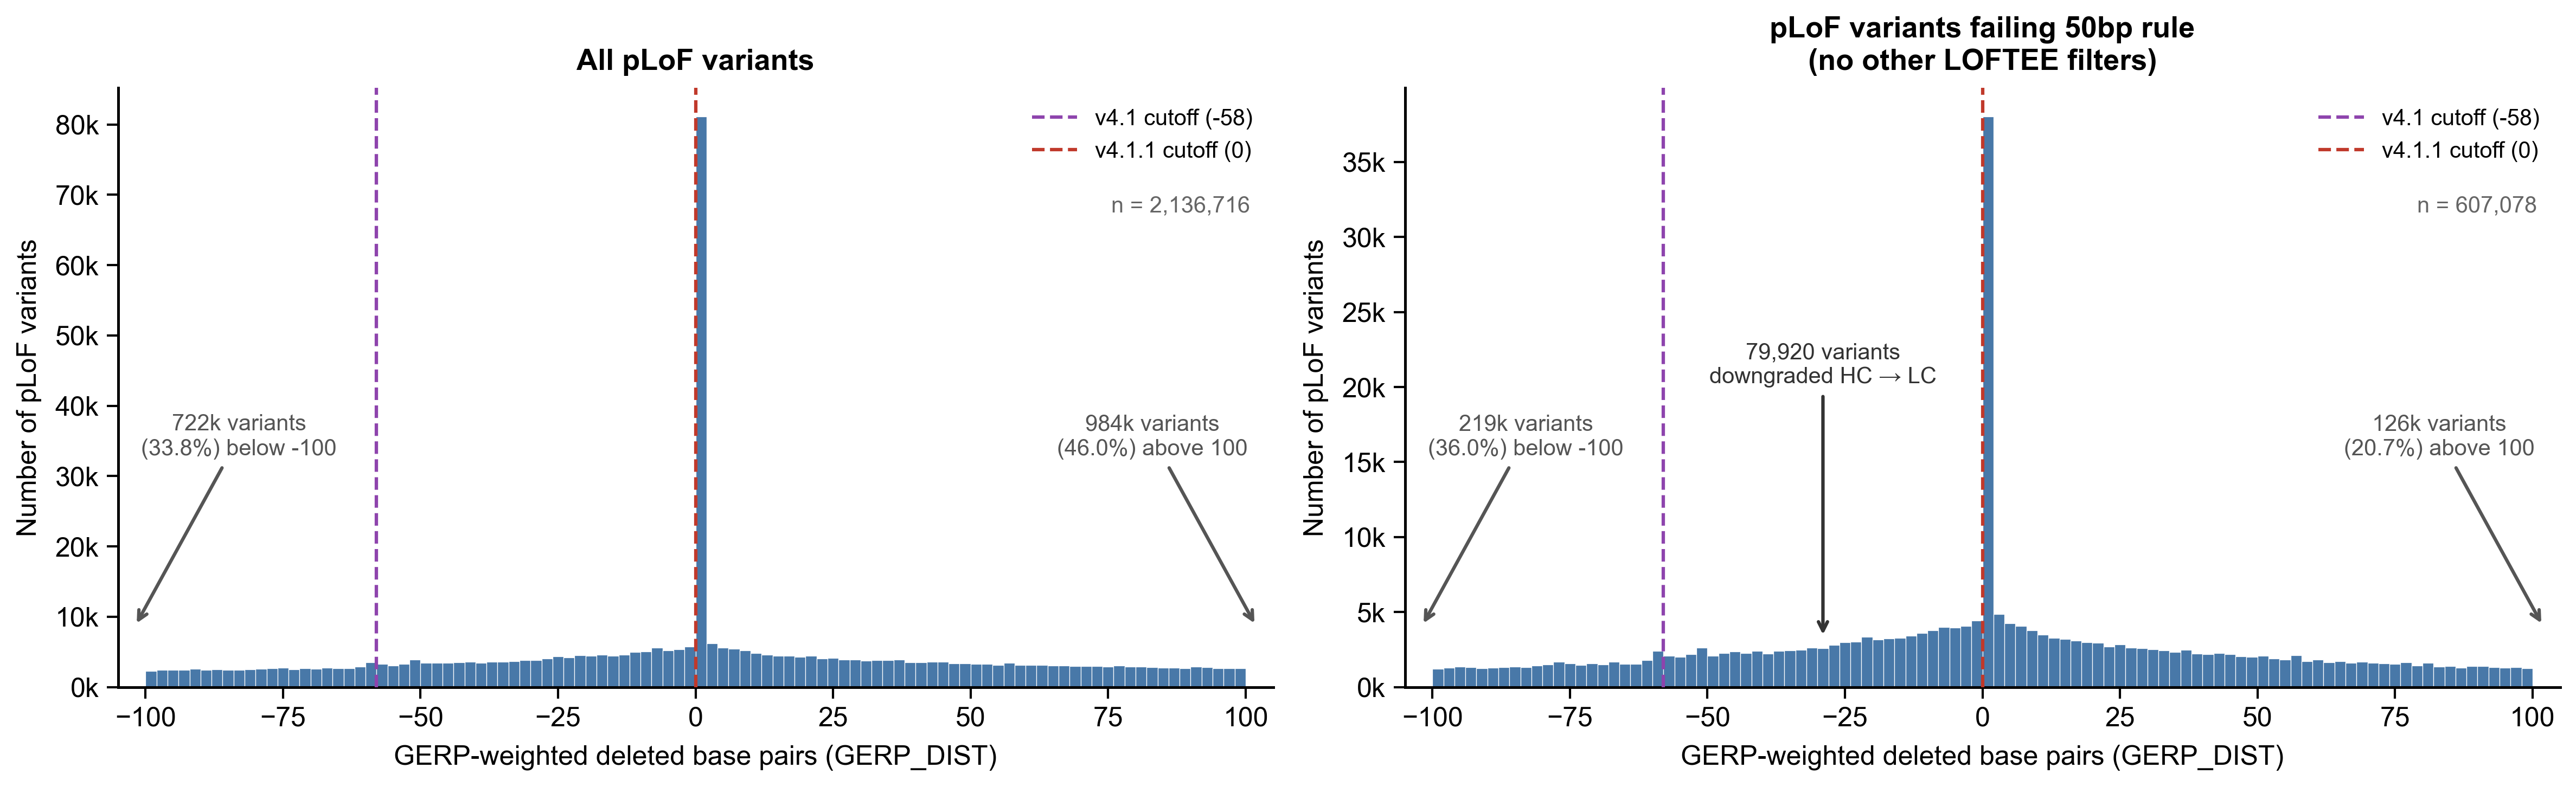
Distribution of GERP-weighted deleted base pairs (GERP_DIST) for pLoF variants in gnomAD v4.1 exomes. (Left) All pLoF variants with a defined GERP_DIST, using the most severe LOFTEE annotation per variant across transcripts (n = 2,136,716). (Right) pLoF variants failing the LOFTEE 50bp rule with no other LOFTEE filters besides END_TRUNC (n = 607,078), representing variants whose pLoF classification depends solely on the GERP_DIST cutoff. Dashed lines indicate the GERP_DIST thresholds used by LOFTEE in v4.1 (-58, purple) and v4.1.1 (0, red). Variants between these thresholds in the left panel (79,920) are reannotated from high-confidence (HC) to low-confidence (LC) pLoF in v4.1.1. Variant counts beyond the displayed range (-100 to 100) are noted with arrows.
gnomAD Exomes pLoF Comparison: v4.1 vs v4.1.1
| v4.1 pLoF | v4.1.1 pLoF | All variants | PASS variant QC |
|---|---|---|---|
| HC | HC | 2,372,647 (84.3%) | 1,417,542 (86.4%) |
| LC | LC | 360,929 (12.8%) | 177,952 (10.8%) |
| HC | LC | 79,920 (2.8%) | 46,204 (2.8%) |
Updated LOEUF calculation
In its original formulation, LOEUF was computed using a frequentist approach: the observed and expected pLoF counts were modelled as Poisson-distributed, and the score was defined as the 95th percentile of the Poisson distribution (equivalently, the upper bound of a central 90% confidence interval) around the observed count, divided by the neutral expectation. While intuitive, this approach treats the true underlying number of pLoF variants as a fixed but unknown parameter, and the confidence interval it produces has a strictly frequentist interpretation — one that does not directly quantify uncertainty about it given the data at hand.
We reframed this estimation within a Bayesian framework, which allows for a more natural interpretation of the uncertainty around a gene’s true underlying number of pLoF variants. Rather than treating this quantity as fixed, we now formally update our beliefs about it after observing the data. Assuming a non-informative prior — meaning we make no assumptions before looking at the data — and modelling observed variant counts as Poisson-distributed (likelihood), the posterior distribution of the true underlying number of pLoF variants given the observed count follows a Gamma distribution. This posterior encodes all values that are reasonably consistent with what was observed. From this distribution, we extracted the 95th percentile as a conservative upper bound: the highest true underlying number of pLoF variants still plausibly compatible with the data. Dividing this upper bound by the neutral expectation yields the Bayesian LOEUF score. The practical interpretation remains the same — scores below one indicate depletion relative to neutrality — but the underlying quantity now has a direct probabilistic meaning.
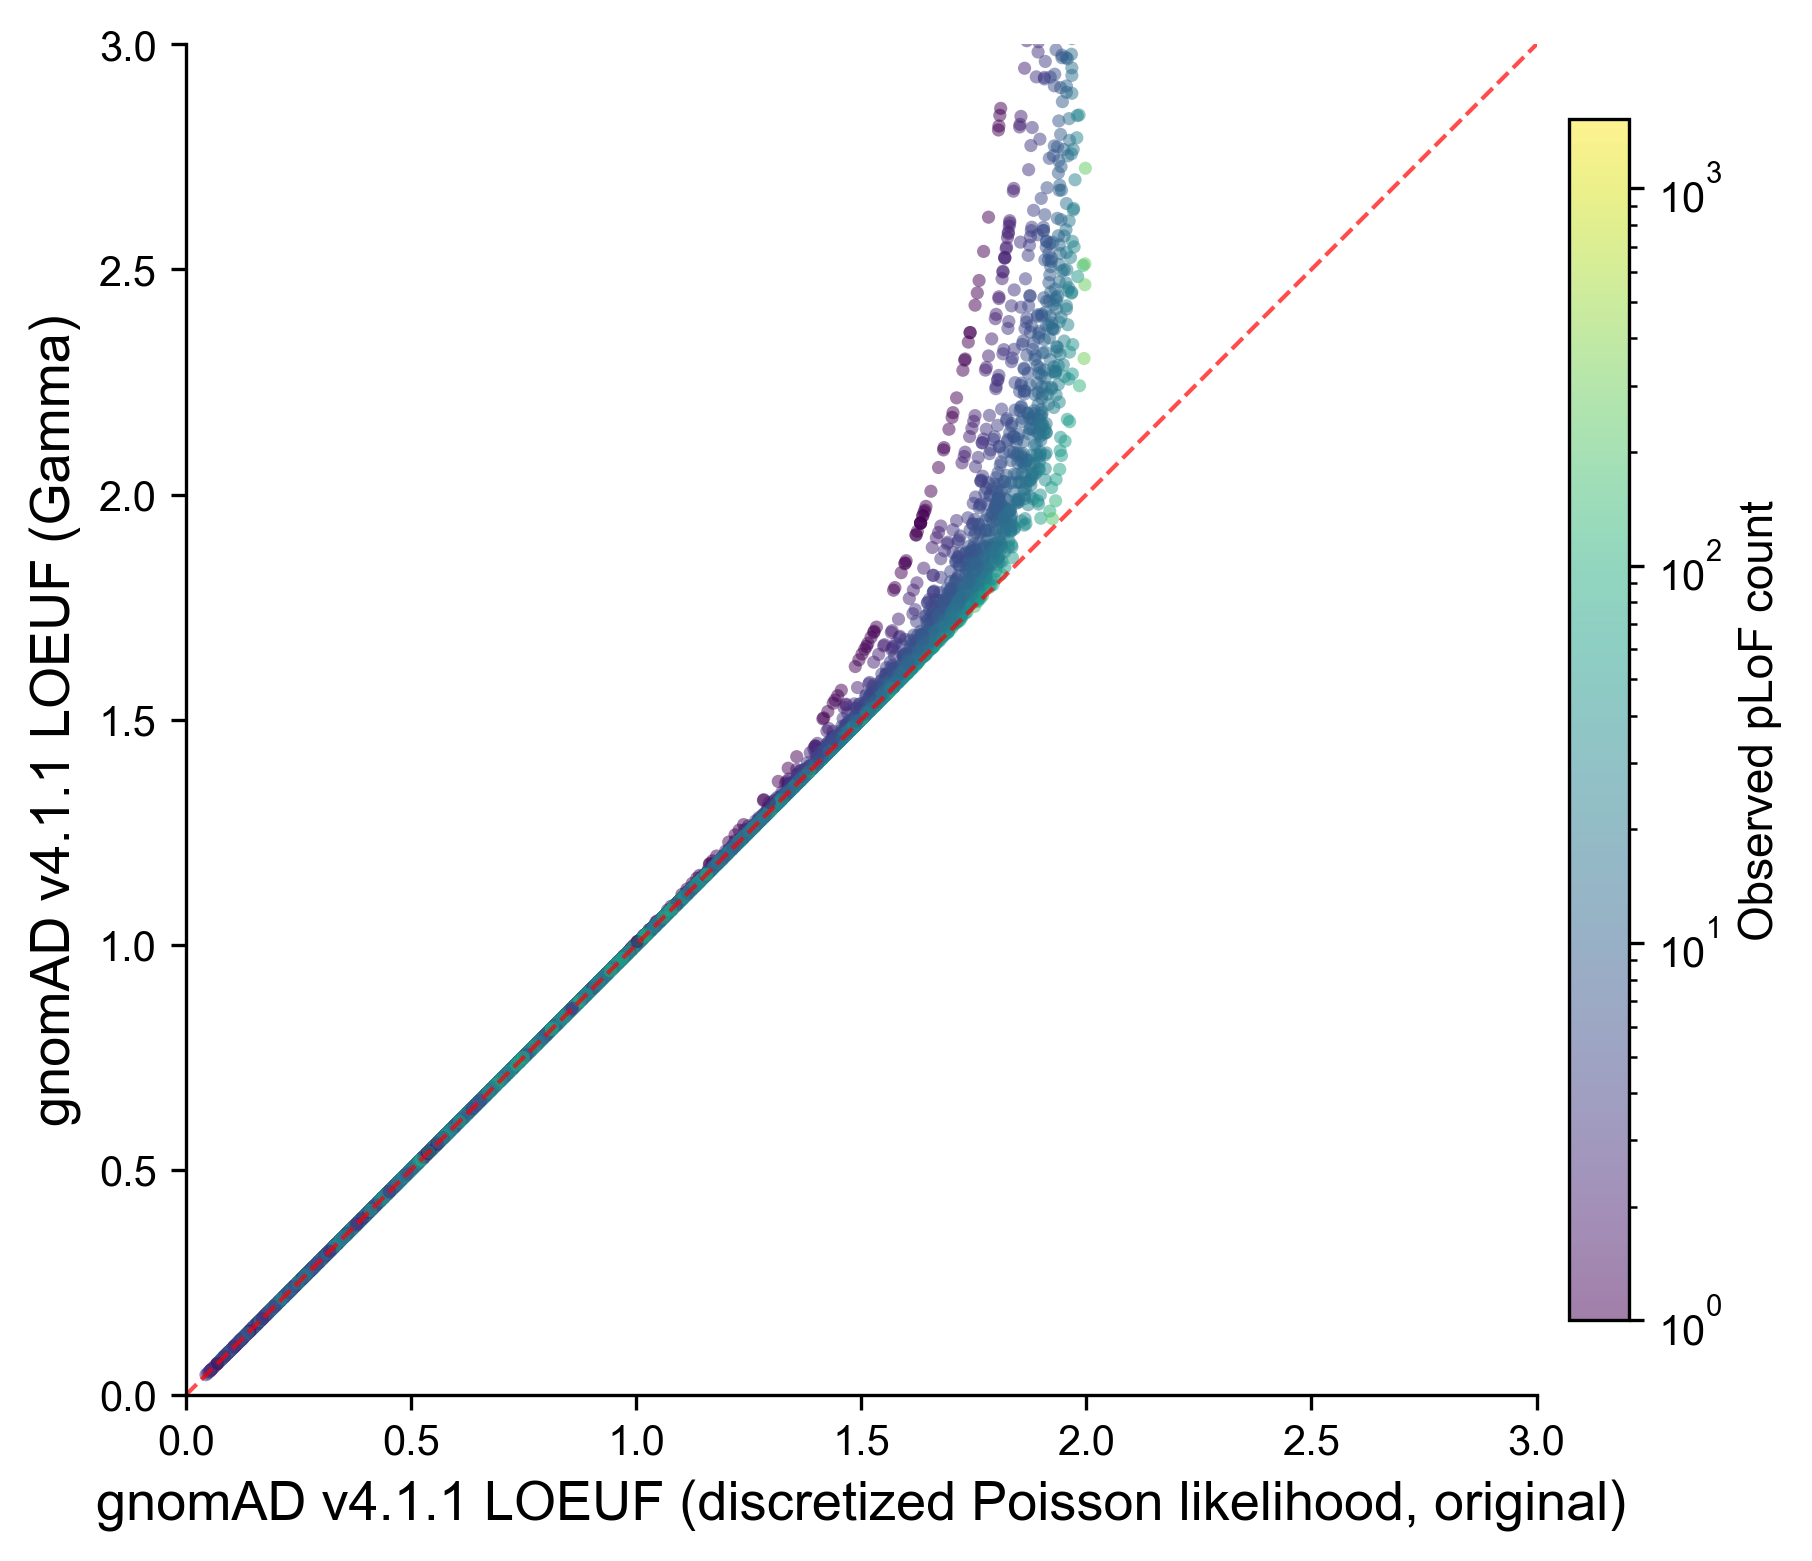
Comparison of LOEUF computed using the original discretized Poisson likelihood method and the new Gamma posterior method for canonical protein-coding transcripts in gnomAD v4.1.1. Each point represents one transcript, colored by observed pLoF variant count (log scale). The two methods produce nearly identical scores for the vast majority of genes (median difference < 0.001), with divergence occurring primarily at high LOEUF values where the original method’s discretization leads to underestimation of the confidence interval upper bound. LOEUF values are truncated at 3.0 in this plot.
GA4GH VRS updates
We have updated the GA4GH VRS object data on reference and alternate alleles to use the latest specification version (v2.0). The updated VRS data includes new VRS identifiers and an updated state model leveraging Reference Length Expressions. These updates support the use of GA4GH Cohort Allele Frequency data through the Hail utilities for gnomAD.
New quality flags on the gene and transcript pages
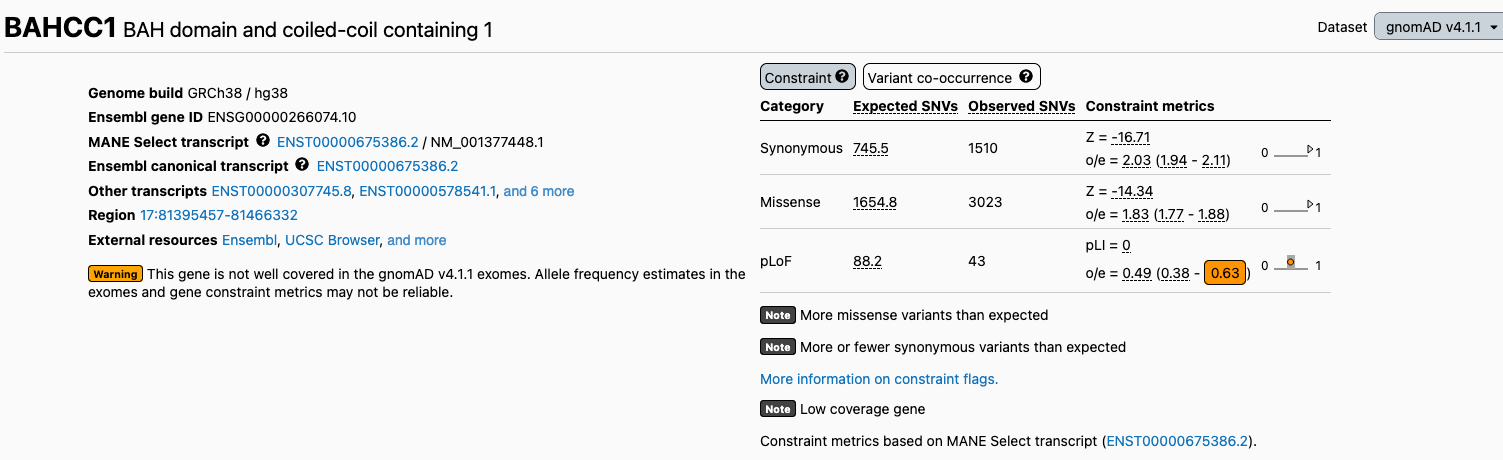
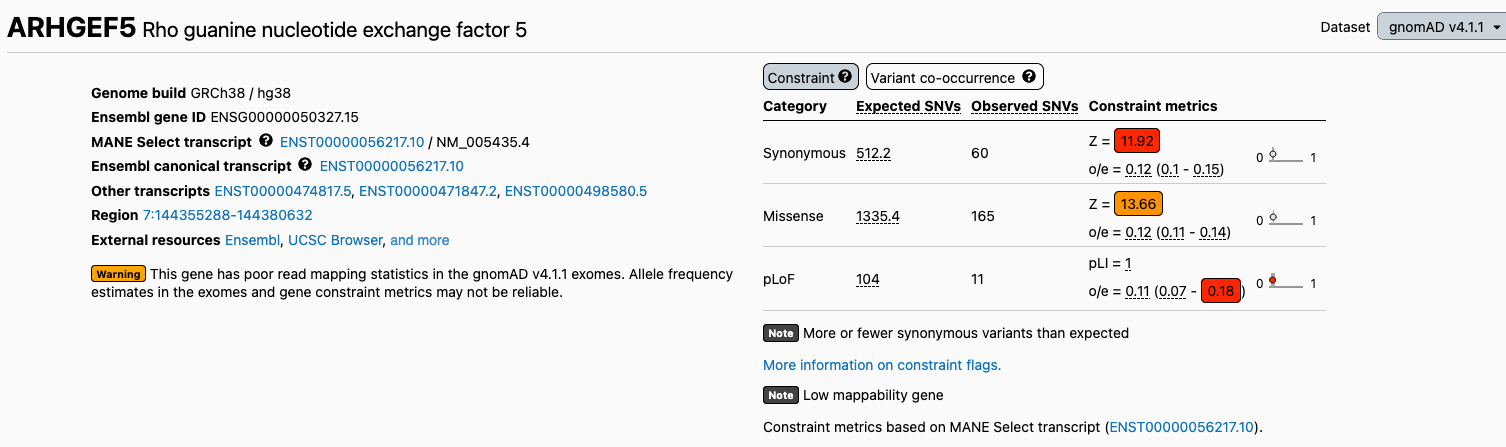
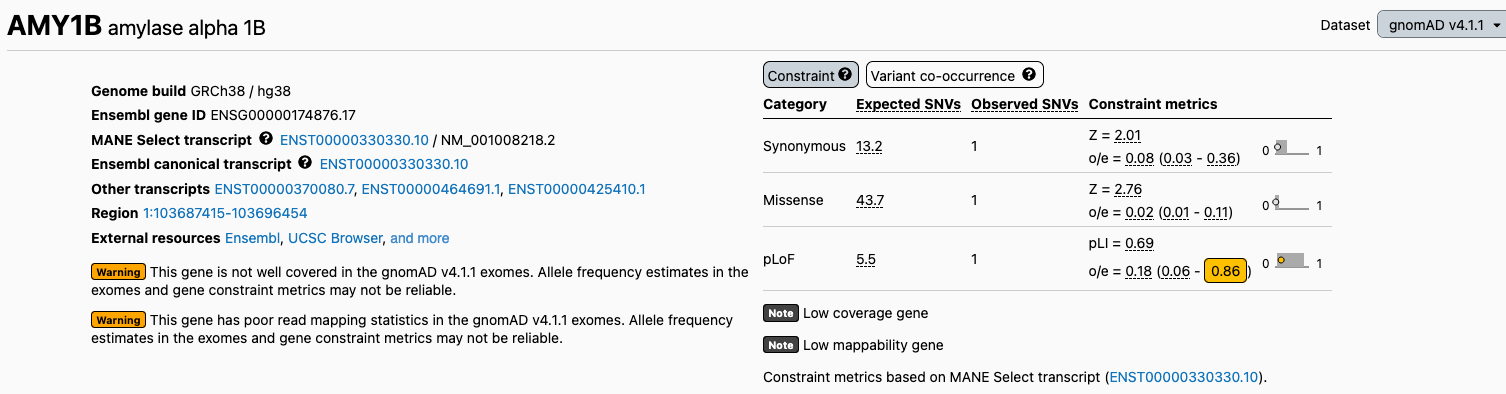
We have added two new flags to the gene and transcript pages to warn users about regions with suspected data quality issues. We now flag 652 transcripts with low exome coverage (“Low coverage gene”) and 623 transcripts with poor mappability in the exomes (“Low mappability gene”), as allele frequency and constraint metrics in these regions may not be reliable. For more information about these flags and how low exome coverage and poor exome mappability were defined, please see our help page.
Low coverage flag:
Low mappability flag:
Low coverage and low mappability flags:
Variant annotation update
As part of this release, we have added Ensembl Variant Effect Predictor (Ensembl VEP) version 115 annotations to the gnomAD v4.1.1 Hail Table downloads. We have also updated the Ensembl VEP annotations for the gene RNU4ATAC and the transcript to ENST00000580972.2 in the browser to align with the clinically-relevant transcript. Aside from this gene, we do not have plans to update the Ensembl VEP version displayed on the browser to maintain compatibility with GTEX v10 and the proportion expressed across transcripts (pext) metric.
How to interpret the gene constraint scores
We release gene constraint metrics to estimate the degree of mutational intolerance across a gene and help prioritize variants that are more likely to be deleterious. We recommend using the LOEUF score due to its ability to provide insight across the spectrum of loss-of-function constraint. We provide the following table to help guide the interpretation of LOEUF:
| LOEUF score | Gene percentile | Number of genes |
|---|---|---|
| < 0.15 | ≤ 1 | 176 |
| < 0.27 | ≤ 5 | 858 |
| < 0.36 | ≤ 10 | 1,709 |
| < 0.45 | ≤ 15 | 2,556 |
| < 0.60 | ≤ 25 | 4,267 |
| < 0.91 | ≤ 50 | 8,536 |
| < 1.19 | ≤ 75 | 12,797 |
This table shows the LOEUF score that corresponds to a gene percentile derived from 17,063 MANE Select transcripts. For applications that require a specific threshold to define pLoF constrained genes, we recommend using a LOEUF score < 0.45. This replaces the previously recommended threshold of LOEUF < 0.35 from gnomAD v2, which reflected the smaller sample size and correspondingly lower LOEUF values in that release. This updated threshold corresponds to a gene percentile of 15 or lower, indicating that genes with LOEUF scores at this threshold or below are among the most highly pLoF constrained 15% of genes.
We validated this threshold by comparing the percentile distributions of LOEUF scores between v2 and v4.1.1 for MANE Select transcripts present in both releases. A LOEUF score of 0.35 in v2 corresponded to about the 16th percentile; the equivalent percentile in v4.1.1 maps to a LOEUF of 0.47, closely matching our recommended threshold of 0.45.
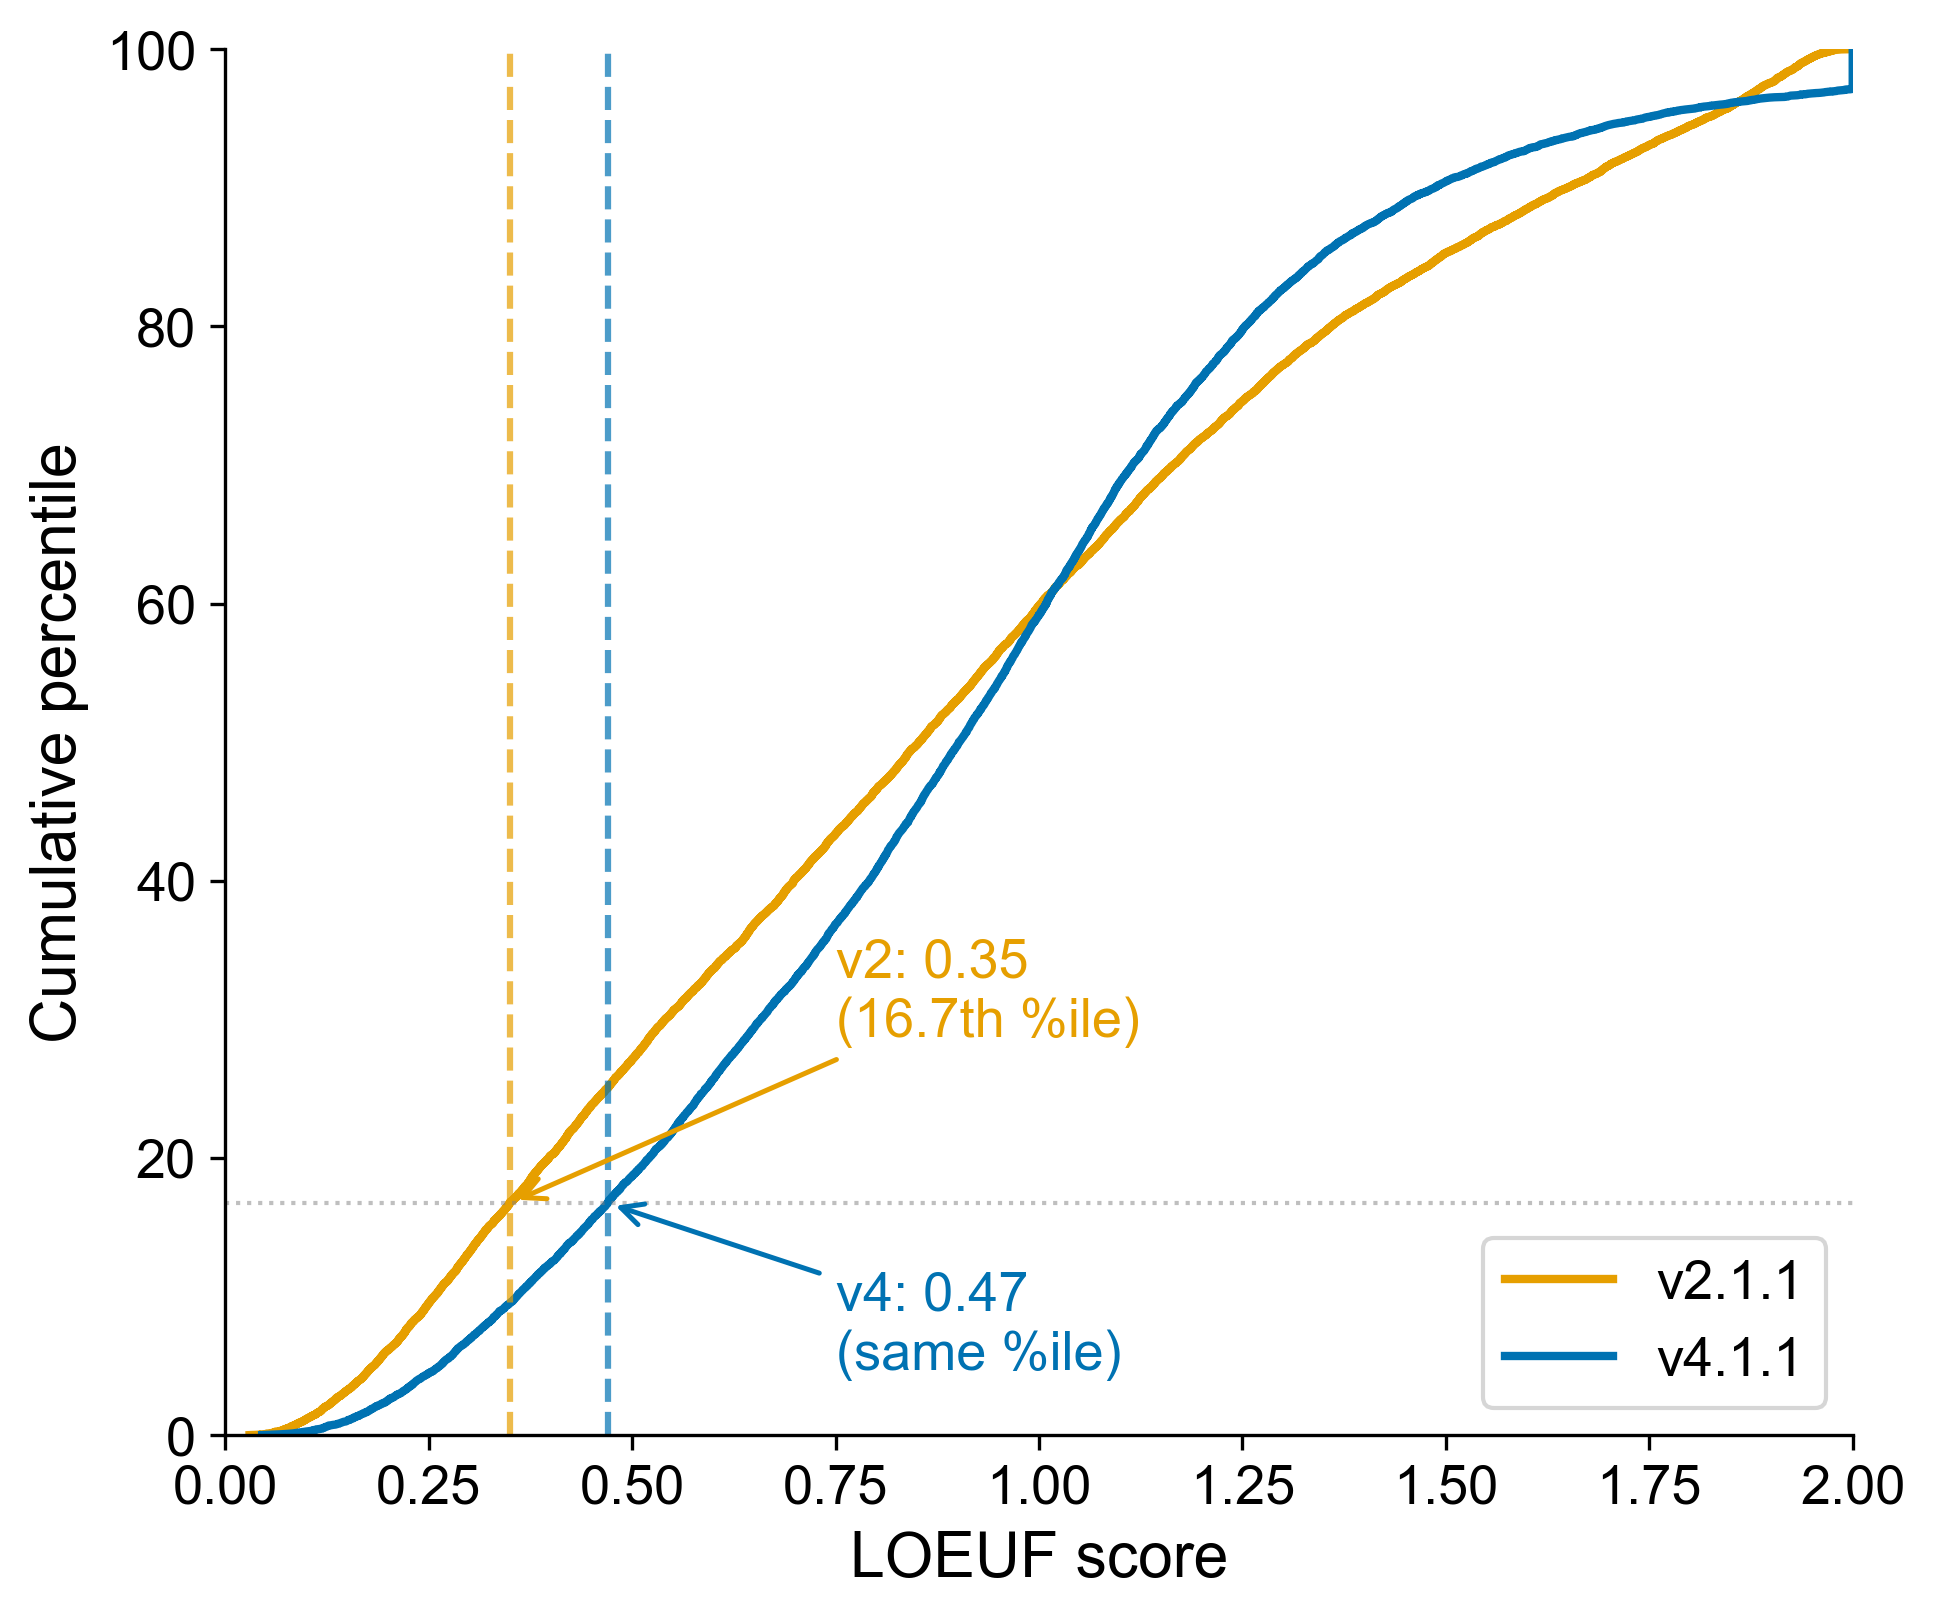
Cumulative distribution of LOEUF scores in gnomAD v2.1.1 (orange) and v4.1.1 (blue) for MANE Select transcripts present in both releases. The v2 threshold of 0.35 corresponds to the 16.7th percentile; the same percentile in v4.1.1 maps to a LOEUF of 0.47, closely matching our recommended threshold of 0.45.
As we noted with the release of constraint scores for gnomAD v4.0, the increase in sample size from gnomAD v2 to v4 means that the numbers of observed and expected variants have also increased. Specifically, as sample size increases, so does the saturation of particular variant classes, with stronger saturation happening for variants (and genes) under weaker selection. This saturation means that the observed number of variants is approaching the expected number of variants per gene, and therefore the observed/expected ratio and LOEUF also both rise. We find higher values for LOEUF for nearly all genes in v4 compared to v2.
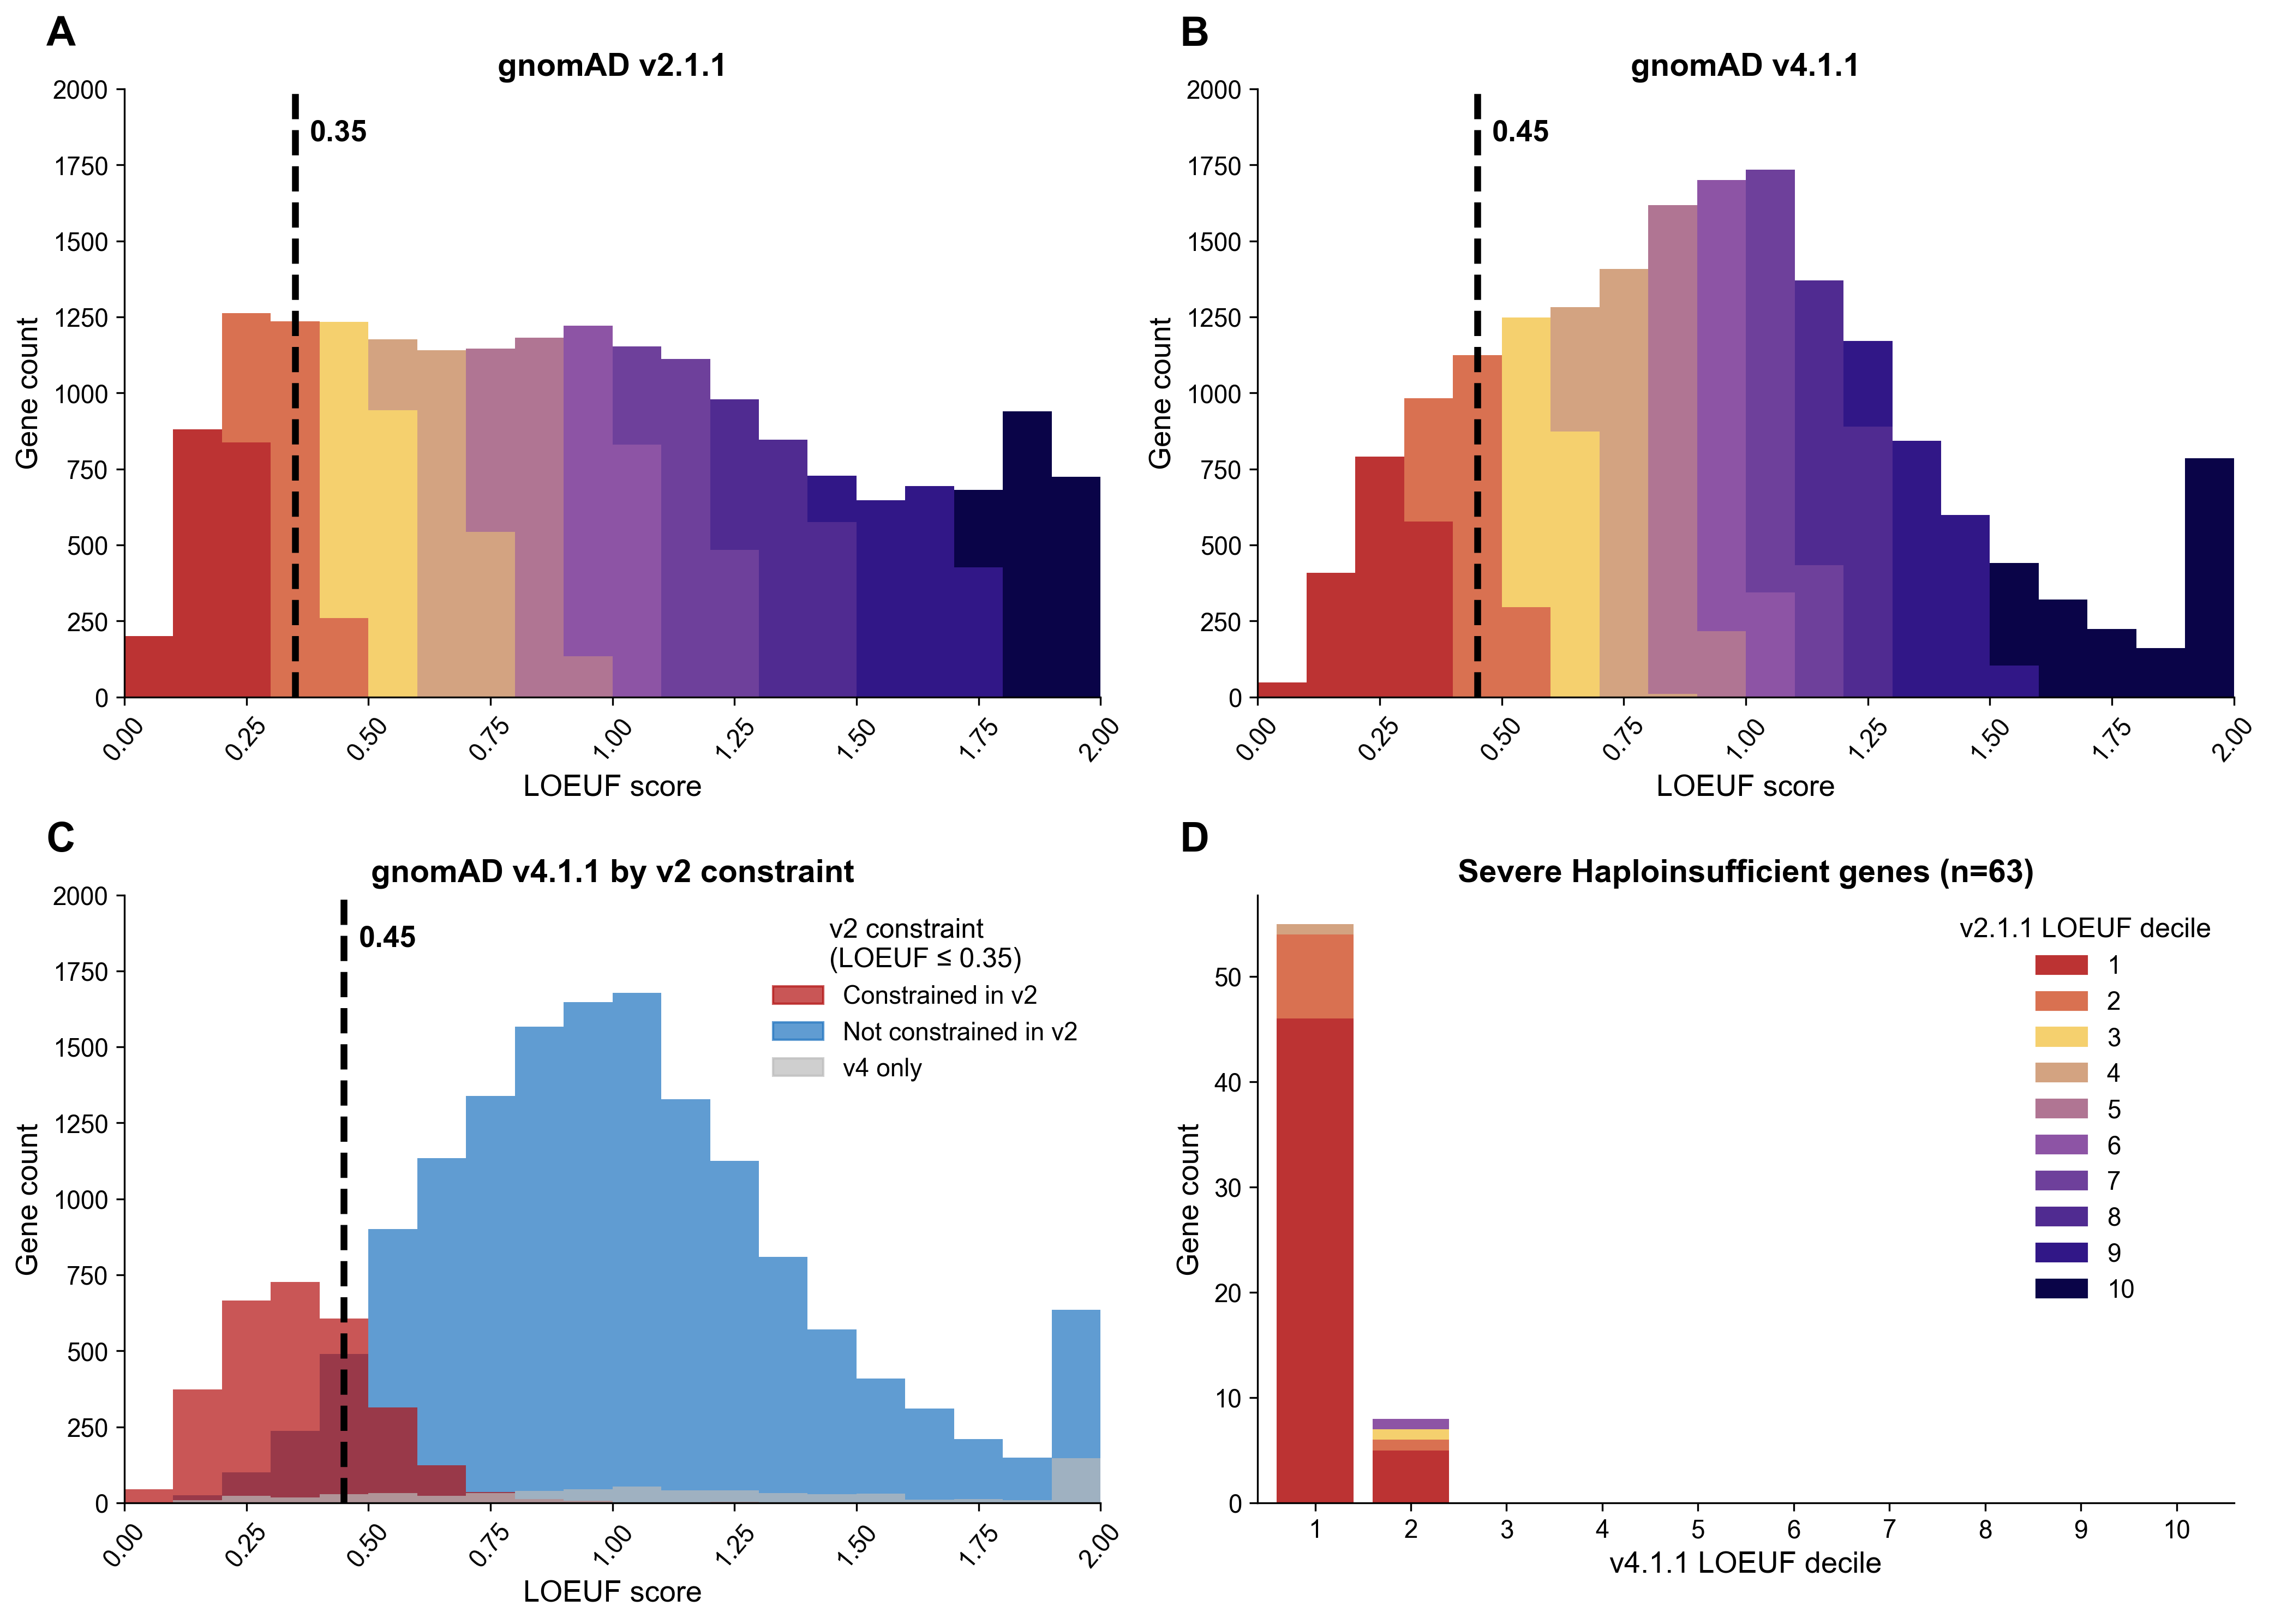
Comparison of LOEUF distributions between gnomAD v2.1.1 and v4.1.1 for canonical, protein-coding transcripts. (A) Distribution of LOEUF scores in gnomAD v2.1.1, colored by LOEUF decile. The dashed line indicates a constraint threshold of 0.35. (B) Distribution of LOEUF scores in gnomAD v4.1.1, colored by LOEUF decile. (C) Distribution of gnomAD v4.1.1 LOEUF scores, colored by whether genes were classified as constrained (LOEUF ≤ 0.35) in v2.1.1. Genes present only in v4 are shown in grey. (D) Distribution of 63 severe haploinsufficient genes across v4.1.1 LOEUF deciles, colored by their v2.1.1 LOEUF decile. Nearly all severe haploinsufficient genes fall within the first two v4.1.1 LOEUF deciles, with the majority also in the first v2.1.1 decile, demonstrating consistent identification of these genes across dataset versions.
How to access the gene constraint scores
The v4.1.1 gene constraint metrics are displayed on the gene pages (e.g., CHD7). The metrics and the calculated mutation rates underlying our expected variant counts are also available for download.
As before, our constraint calculations are made using unique single nucleotide variants with a minor allele frequency < 0.1% (see more information in our FAQ).
End notes – still a work in progress!
We are continuing to refine our selective constraint methods to better model the spectrum of mutational constraint. In the interest of releasing data to our users as soon as possible, we will continue to create incremental releases of our work in progress; this includes a couple updates to gene and regional constraint metrics, as detailed in our new3 and upcoming preprints. We encourage users to explore the updated metrics and provide feedback or ask questions on our forum.
Reference
- Karczewski, K. J., Francioli, L. C., Tiao, G., Cummings, B. B., Alföldi, J., Wang, Q., Collins, R. L., Laricchia, K. M., Ganna, A., Birnbaum, D. P., Gauthier, L. D., Brand, H., Solomonson, M., Watts, N. A., Rhodes, D., Singer-Berk, M., England, E. M., Seaby, E. G., Kosmicki, J. A., … MacArthur, D. G. The mutational constraint spectrum quantified from variation in 141,456 humans. Nature. 581, 434-443 (2020). https://doi.org/10.1038/s41586-020-2308-7 PMID: 32461654
- Davydov, E. V., Goode, D. L., Sirota, M., Cooper, G. M., Sidow, A., & Batzoglou, S. Identifying a high fraction of the human genome to be under selective constraint using GERP++. PLOS Computational Biology, 6(12), Article e1001025 (2010). https://doi.org/10.1371/journal.pcbi.1001025
- Guez, J.*, Goodrich, J. K.*, Moldovan, M. A., Chao, K. R., Kar, P., Panchal, R., Wilson, M. W., Laricchia, K. M., Rohlicek, G., Biba, D., Marten, D., He, Q., Darnowsky, P. W., Grant, R., Weisburd, B., Baxter, S. M., Nadeau, J., Lu, W., … Samocha, K. E.†, Karczewski, K. J.†. Integrating 730,947 exome sequences with clinical literature improves gene discovery. medRxiv. (2026). https://doi.org/10.64898/2026.03.23.26349081