We have released gnomAD v4.1, an update to our latest major release. This update fixes the allele number issue in gnomAD v4.0 previously described here and critically adds two new functionalities: joint allele number across all called sites in the exomes and genomes and a new flag indicating when the frequencies in the exomes and genomes are highly discordant.
Allele numbers across all possible sites
As part of gnomAD v4.1, we have calculated allele number across all callable sites in the gnomAD exomes and genomes. In traditional callset processing, allele number (AN) information is only retained at sites where at least one sample has a non-reference genotype call (i.e., AN information is not retained at sites where all samples have homozygous reference genotypes). However, due to the lossless conversion of sample genomic VCF (gVCF) data to the Hail VariantDataset (VDS) format, we actually retain AN information across all called sites within the raw gnomAD callsets.
We have leveraged this VDS feature for the first time as part of gnomAD v4.1 and created two new files that contain sample ANs across every called site in the gnomAD exomes and genomes. This means that for any loci absent from these files, zero gnomAD samples had any kind of genotype call (either reference or alternate) in their sample gVCF.
The calculation of AN across all called sites allows us to do two new things:
- Combine exome and genome allele numbers at all sites with gnomAD variation
- [Downloads only] Provide AN information for loci that do not have variation observed within gnomAD to date
Joint allele numbers at all sites with gnomAD variation
On the browser and in the downloadable files, we now report AN for both data types if the variant was called in either data type. In previous gnomAD releases, if a variant was exclusive to a single data type (i.e., variant present in only the exomes or only the genomes), we only reported AN for that data type. For example, 1-55505582-TC-T in gnomAD v2.1.1 is present only in the v2.1.1 exomes, and therefore the total AN at this site only contains information from the exomes. This variant maps to 1-55039909-TC-T in gnomAD v4.1, where it still has an allele count of 1 (still present in only a single exome sample). However, the total AN of this variant is now 1,565,390, which reflects the sum of exome AN (1,413,216) and the previously uncalculated genome AN (152,174).
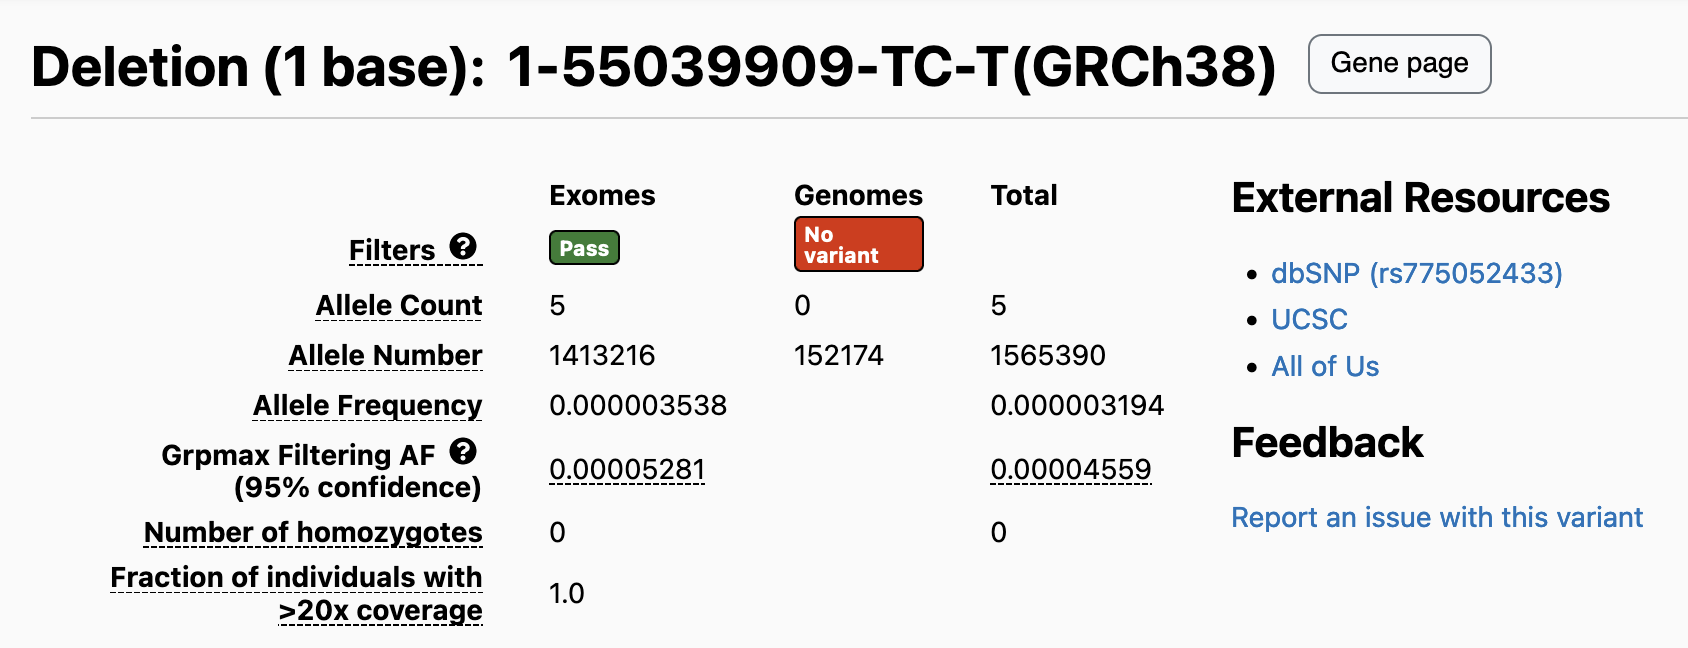
Allele number information at non-variant loci
We have calculated AN information for loci that do not yet have variation observed within gnomAD. This means that even for loci where zero gnomAD samples have a non-reference genotype call, we report the exact AN based on the total number of defined sample genotype calls at that site, something that users were previously only able to estimate based on coverage data. For more information, see our help page. Note that we do not display this information on the browser; users will need to download our new files to extract this information.
Other considerations
Our new calculations have allowed us to report sample AN across all called sites within gnomAD. This means that sites not present within these files do not have any genotype information (reference or any alternates) in the gnomAD samples. The main reasons why sites do not have genotype calls are because they are not within our calling intervals, or they are sites that are not amenable to short read sequencing.
The gnomAD v4.1 callset includes 416,555 UK Biobank and 314,392 non-UK Biobank exomes, requiring the use of two calling interval lists for processing and quality control pipelines. The non-UK Biobank samples were called with the standard Broad exome calling intervals intervals with 150 base pairs of padding and the UK Biobank samples were called using the UK Biobank target list with 150 base pairs of padding. We encourage our users to check the region flags in our allele number downloadable files to determine whether a significantly lower than expected AN can be attributed to capture technology. For more information on how exome capture and calling intervals impact AN, please see our help page.
Breakdown of variant counts within Broad and UKB capture and calling (150bp padding) intervals
| UKB Intervals | Totals | |||||
|---|---|---|---|---|---|---|
| Inside calling | Outside calling | |||||
| Inside capture | Outside capture | |||||
| Broad Intervals | Inside calling | Inside capture | 21718832 | 10767326 | 9260124 | 41746282 |
| Outside capture | 169986 | 22626798 | 3979059 | 26775843 | ||
| Outside calling | 331764 | 298034 | NA | 629798 | ||
| Totals | 22220582 | 33692158 | 13239183 | 69151923 | ||

Joint (combined) exome + genome frequencies
For the first time, in gnomAD v4.0, we released a combined filtering allele frequency (FAF), integrating variant allele frequencies across the 734,947 exomes and 76,215 genomes. Combining these two datasets gives us the advantage of a larger, more diverse sample set. However, it also introduces challenges related to integrating datasets that not only differ in their sequencing and processing methods, but also exhibit variations in sample composition due to ascertainment biases.
As part of gnomAD v4.1, we provide users with a warning when a variant has highly discordant frequencies between the gnomAD exomes and genomes. For variants observed in a single inferred genetic ancestry group, we apply Hail’s contingency table test to allele counts in that group. In cases where the variant is present in multiple genetic ancestry groups, we use the Cochran–Mantel–Haenszel (CMH) test computed by Hail’s implementation, to compare variant frequencies while accounting for differences driven by inferred genetic ancestry group structure in the datasets. For variants present in both exomes and genomes, we display the contingency table test or CMH p-value and add a warning flag to variants where the p-value is less than 10-4. We find that at this threshold, ~2.5% (2,230,151 out of 91,177,483) of variants have statistically different frequencies in the two data types. For more information, see our combined frequency help page.
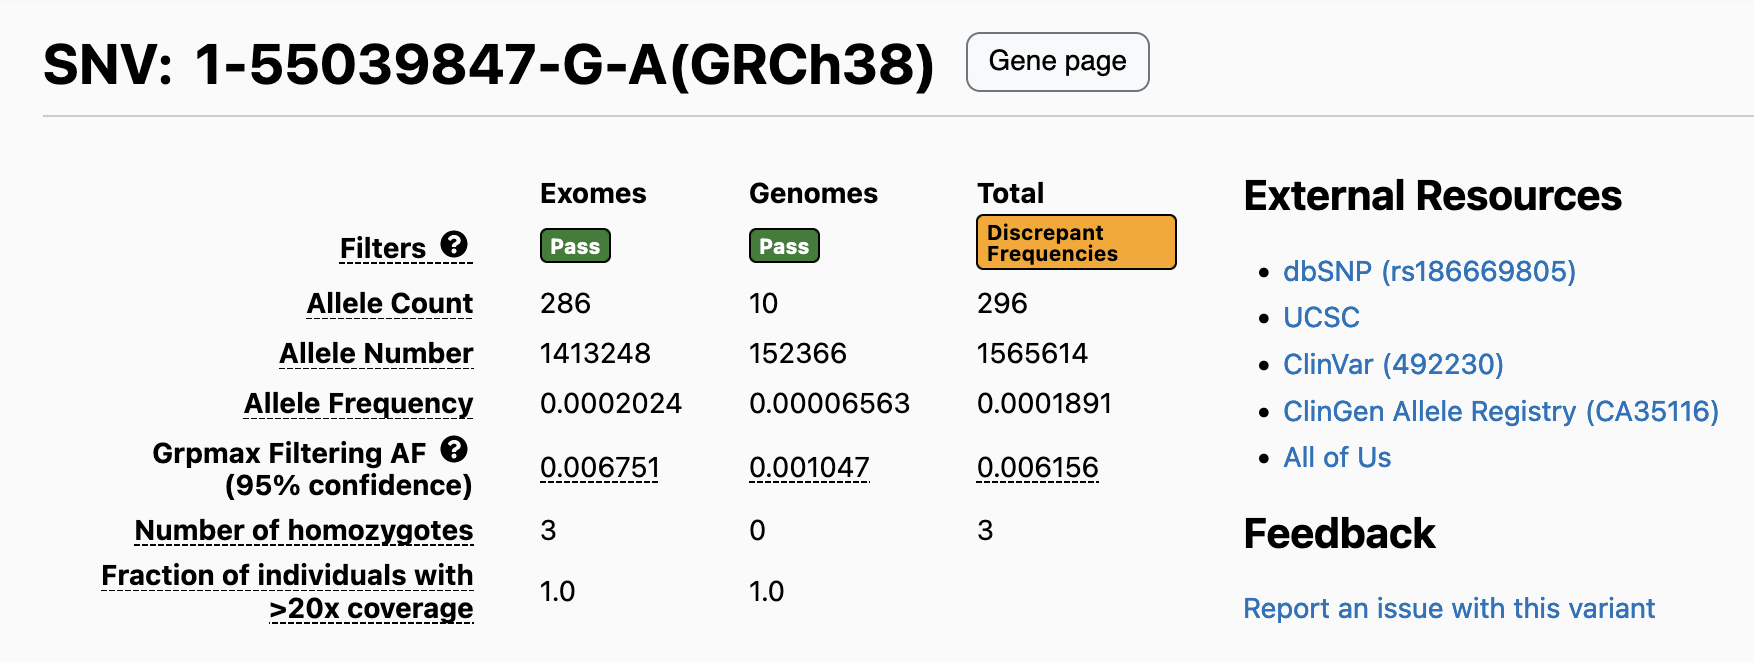
The expected number of variants with a p-value of less than or equal to 10-4 in 91 million variants is 9,100. This means that the number of variants we observe at this cutoff is enriched by ~245x over the number we expect to observe by chance. The p-value distribution (see below) does not show much baseline inflation, so given our massive enrichment at this cutoff, we don’t expect that a large percentage of variants are being falsely flagged.
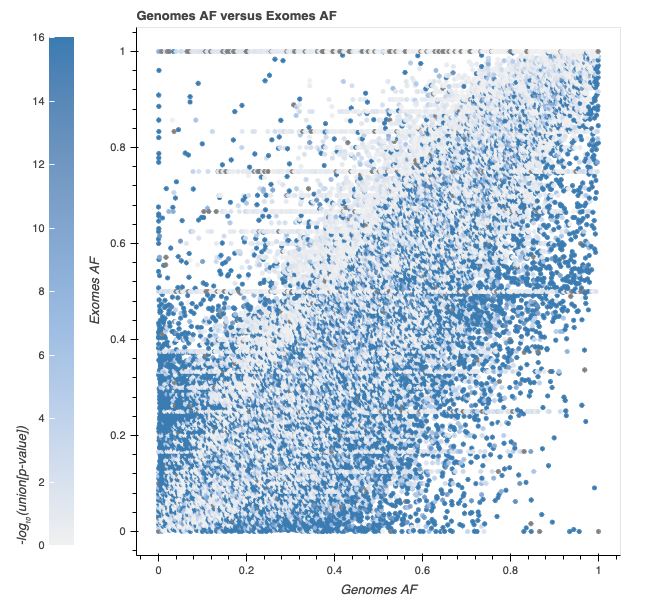
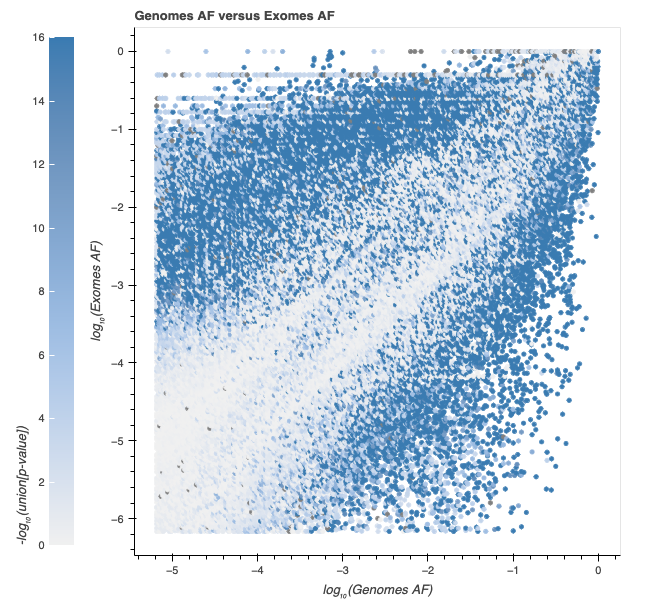
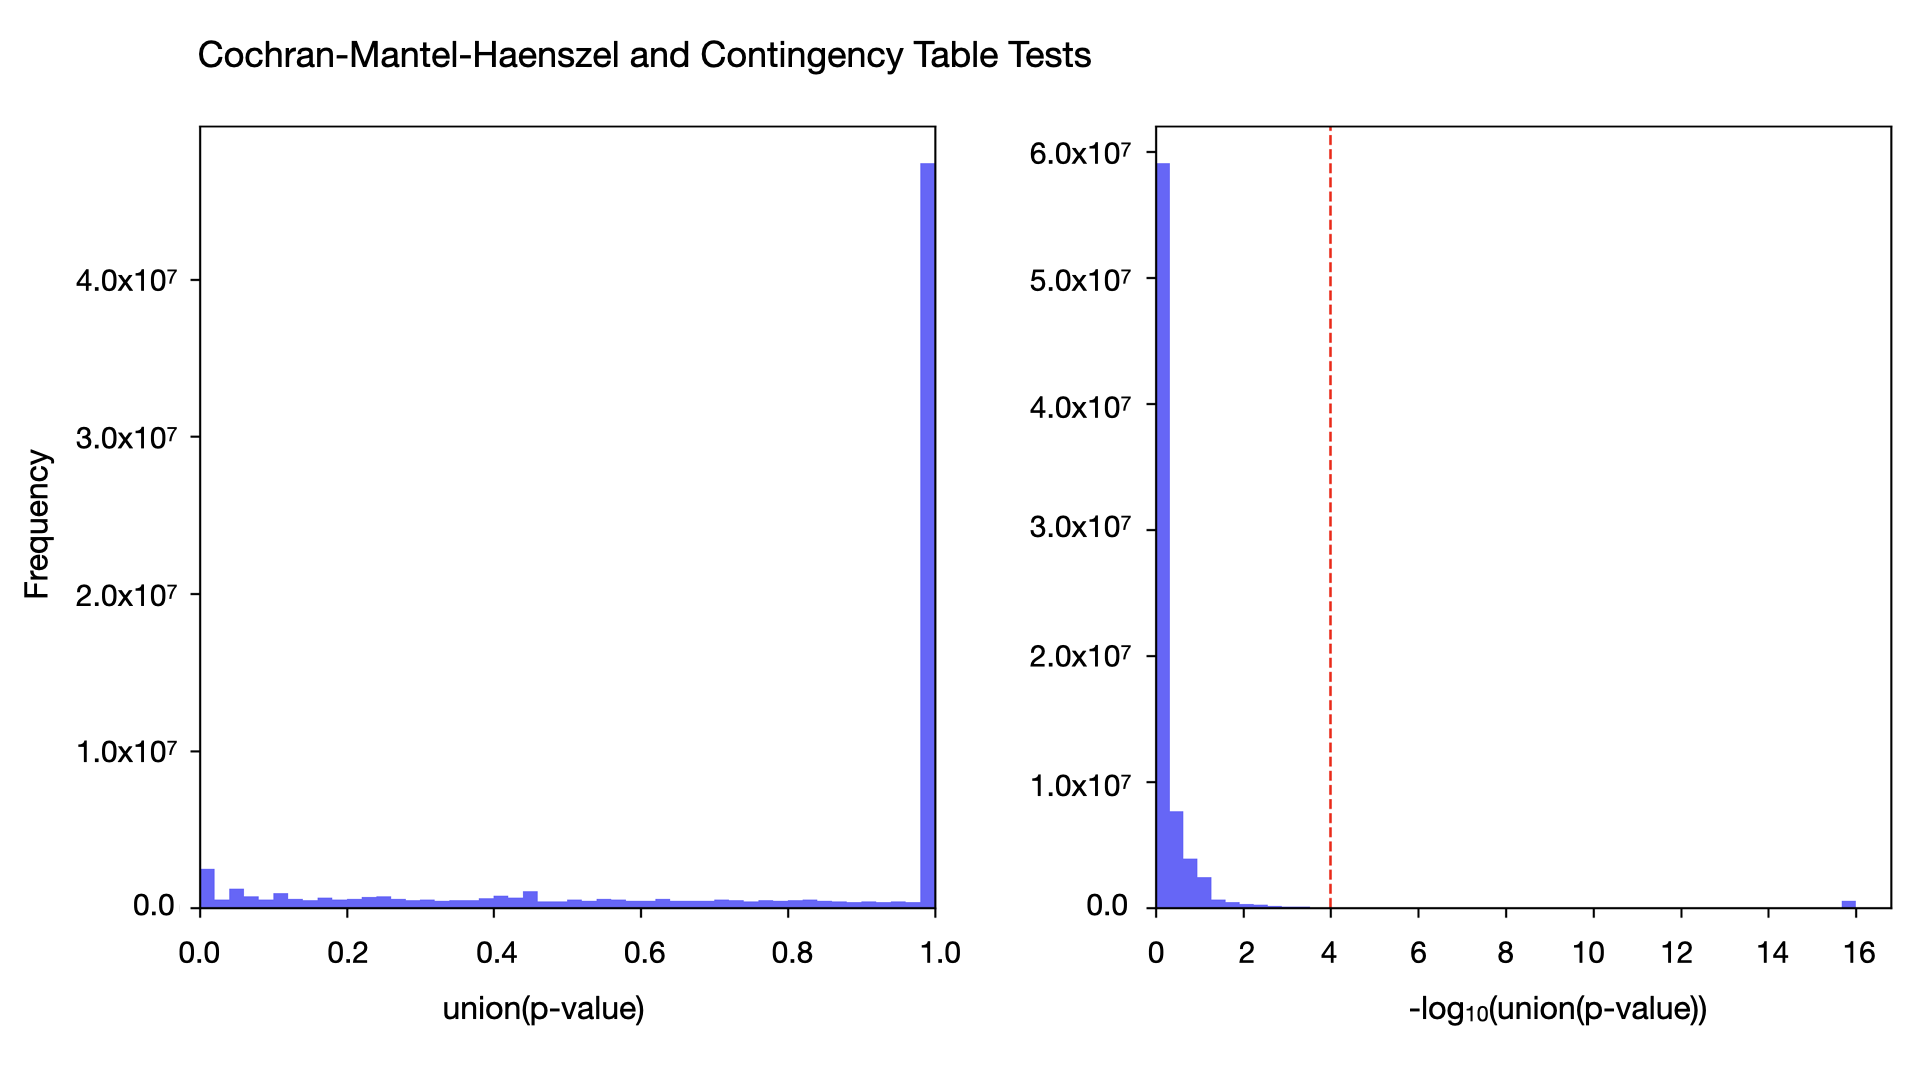
This is the first time our team has provided a statistical method to identify variants with allele frequency differences between the exomes and genomes. However, this is something that many users have independently observed over the years. We often receive inquiries on how to interpret this discrepancy and whether there is one data type that has more “reliable” frequencies. Unfortunately, there is no simple answer to this, and when the two data types have discordant frequencies, determining which frequency to apply in downstream applications is often highly context-dependent.
Here are some of the reasons that might lead to the observed differences:
-
Sample set composition: The exomes and genomes datasets are non-overlapping sample sets and are composed of samples with different genetic ancestries even within the same top-level genetic ancestry group label. Although we try to take this into account by stratifying the CMH by inferred genetic ancestry groups, some of the allele frequency discrepancies might still reflect underlying differences in population genetics that are not fully controlled for in the CMH test. There may be regions or groups of individuals only represented in one of the datasets at present based on different cohorts being included in gnomAD genomes and exome datasets.
-
Technical explanations: In most cases, technical differences such as differences in coverage or sequencing technology will equally affect the reference and alternate alleles. However, in some cases, these factors could differentially affect alternate and reference alleles, resulting in AF discrepancies between the two data types.
-
Coverage: Whole-genome sequencing provides more uniform coverage across the entire genome, while exome sequencing focuses on the exons within the capture target regions, resulting in spikier but higher coverage of these specific regions. The exome coverage is highest within the regions directly targeted by capture probes, gradually decreasing towards the boundaries of these target areas, and diminishes significantly as it approaches off-target regions. These differences in coverage can contribute to allele frequency discrepancies between the two data types.
-
Sequencing technology and bias: Sequence context, including genomic location and complexity (e.g., GC-rich regions), can affect both the capture efficiency in exome sequencing and the uniformity of coverage in genome sequencing.
-
Technical artifacts: Single nucleotide variants (SNVs) exhibit different patterns in AF discrepancies than insertions or deletions (indels), as reported in Atkinson et al1. SNVs tend to have larger AFs in genomes than exomes, and this pattern is not observed in indels1. In addition, indels generally tend to have less stable frequency estimates1, likely because most of the indels in gnomAD tend to occur in low-complexity regions or in regions overlapping a segmental duplication (see flags).
-
We recommend that users take the location of the variant (genomic location, mappability, sequence context) and coverage in each data type (by checking sample allele number information) into account when assessing these variants.
We have released these new joint frequencies and their comparison p-values. We have two notes about these data: one, we included joint frequencies on the exome and genome release files as part of v4.0 but have released this standalone resource as part of v4.1, and two, these data are currently available only in the Hail Table format.
We welcome feedback about our new features and encourage users to post questions or suggestions on our forum.
Acknowledgments
Qin He generated the figures depicting the Cochran–Mantel–Haenszel test and contingency test p-values.
References
Atkinson, E. G., Artomov, M., Loboda, A. A., Rehm, H. L., MacArthur, D. G., Karczewski, K. J., Neale, B. M., & Daly, M. J. (2023). Discordant calls across genotype discovery approaches elucidate variants with systematic errors. Genome research, 33(6), 999–1005. https://doi.org/10.1101/gr.277908.123