As a part of gnomAD V4, we are excited to include our first gnomAD release of rare (<1% overall site frequency) autosomal coding copy number variants (CNVs) from exome-sequencing (ES) in 464,297 individuals. These data are available to explore in the user-friendly gnomAD browser (https://gnomad.broadinstitute.org/), while the complete annotated rare CNV callset can be downloaded directly from the downloads page.
Exome CNV discovery method: GATK-gCNV
To call rare coding CNVs from ES of 464,297 individuals included in this gnomAD v4, we applied our recently published method, GATK-gCNV (Babadi et al. Nat Genet, 2023).
. Graphical depiction of GATK-gCNV pipeline.")
Fig. 1 (Babadi et al. Nat Genet 2023). Graphical depiction of GATK-gCNV pipeline.
As a brief overview, we started by collecting the number of reads that map to the set of 363,301 autosomal target intervals derived from protein-coding exons (Fig. 1a,b, shared in Babadi et al.). We used the read counts of target intervals for which sample-level read counts help differentiate technical factors between samples, such as different exome capture kits or sequencing centers, and generated 1,045 different batches of samples for parallel processing (Fig. 1c). For each of these batches, we selected 200 random samples to train GATK-gCNV in cohort mode, which can be thought of as the creation of a “panel of normals” (often abbreviated “PoN”). The resulting PoN models were then used to efficiently delineate CNV events on all of the samples of their respective cohorts using the GATK-gCNV case mode (Fig. 1d,e).
The raw, individual-level CNV calls produced by GATK-gCNV for all samples were then collated, and variants observed in multiple individuals were clustered using single-linkage clustering. We executed quality filtering as described in Babadi et al., filtering CNVs based on sample-level (number of events per individual) and call-level (frequency, size, quality score) metrics. Due to the significant increase in cohort size and heterogeneity compared to the datasets reported in Babadi et al., we introduced some additional filters. We excluded samples that had more than five different chromosomes harboring rare CNVs, as well as samples that harbored more than three rare terminal CNVs. There were 1,049 sites that produced noisy normalized read-depth signals and were also masked. The final retained CNVs and sites were subsequently annotated for impacted genes and frequencies.
CNV discovery benchmarking
In Babadi et al., we used a set of over 7,000 samples that had matching ES, genome sequencing (GS), and microarray data to conduct extensive benchmarking of the performance of GATK-gCNV. Using our recommended filtering procedures, we found that GATK-gCNV achieved >90% precision (Fig. 2b) compared to GS results for rare coding CNVs that span greater than two exons. These performance figures represent a significant improvement over the existing exome CNV methods also benchmarked (Fig. 2a,b), including XHMM, which was used for the generation of exome CNVs in the Exome Aggregation Consortium (ExAC) project. We adopted these same filtering procedures for the gnomAD V4 rare coding CNV callset generation. We repeated this benchmarking for 4,010 samples that were jointly processed with gnomAD V4 CNVs, and we were again successfully able to recapture variants at >90% precision (Fig. 2c) at a threshold of more than two exons, with a modest decrease in recall (Fig. 2d) resulting from variant clustering across a much larger, more technically heterogeneous dataset.
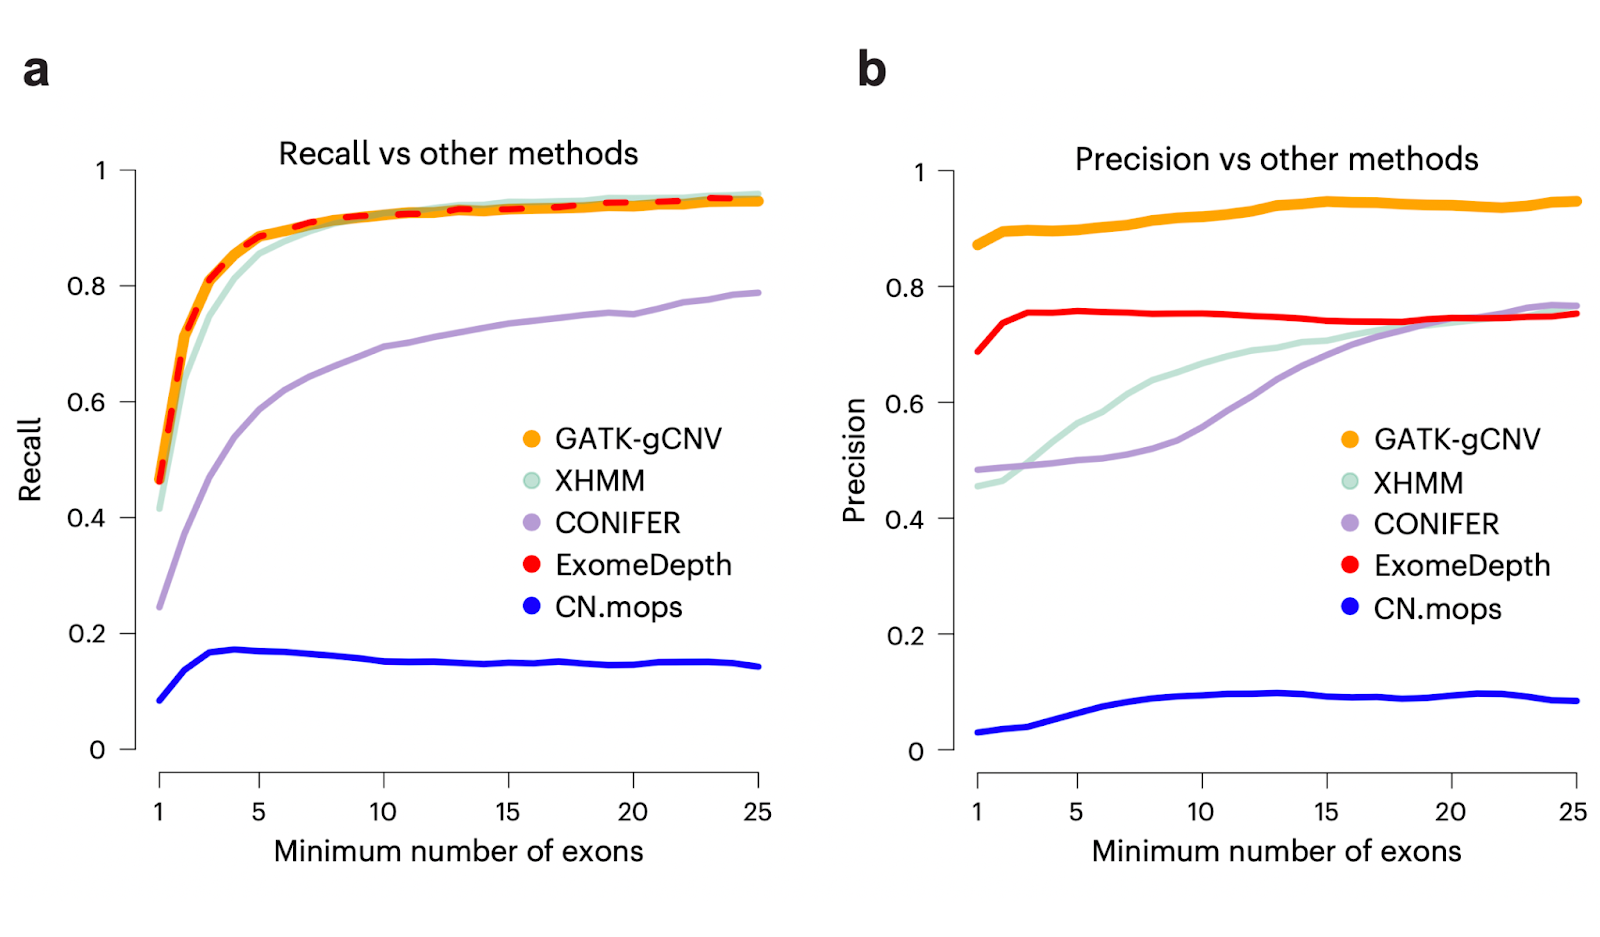
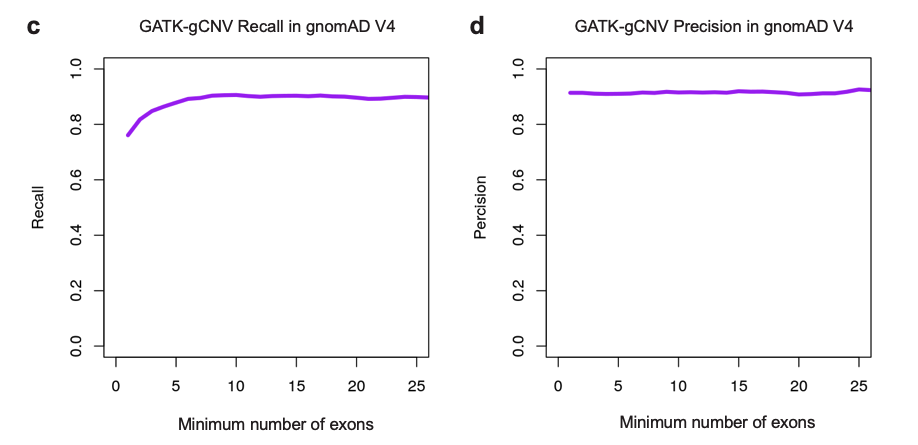
Fig. 2. The performance of GATK-gCNV reported in Babadi et al. and repeated for overlapping data in V4.
Dataset statistics
In total, we discovered 66,903 high-quality, rare coding CNV sites across the 464,297 individuals released here, including 30,877 are deletions and 36,026 duplications. We observed more large duplications than deletions, where on average deletions spanned 6 exons, while duplications spanned 10 exons, which is consistent with an expectation of stronger selection against large deletions. On average, we observed 1 rare coding CNV per individual, with 32% of samples harboring a rare coding deletion, while 46% of samples carried a rare coding duplication. We observe 0.6 genes to be deleted on average per individual, and 1.2 genes duplicated. When leveraging the loss of function observed/expected upper-bound fraction (LOEUF, Karczewski et al. Nature, 2020) constraint metric introduced in gnomAD v2, we observe 0.02 constrained genes to be deleted on average per individual and 0.07 genes duplicated amongst the most constrained set of 2,968 genes defined as LOEUF < 0.35.
Importantly, in this dataset, we have significant improvements of representation of individuals from a range of genetic ancestry groups (Table 1), including 83,968 samples of non-European genetic ancestry, allowing us to uncover significant differences in the rate of certain variants by groups. In aggregate, while genetic ancestry groups differ as expected in terms of the number of rare deletions and duplications, when CNV discovery is restricted to those variants that alter the coding sequence of constrained genes, we observe minimal difference in the CNV rates between groups, consistent with previous short variant analyses.
| afr | amr | asj | eas | fin | mid | nfe | sas | |
|---|---|---|---|---|---|---|---|---|
| N | 11,335 | 20,800 | 10,397 | 15,938 | 22,688 | 1,414 | 326,266 | 34,481 |
Table 1. The number of samples in each inferred genetic ancestry group with available high-quality rare CNV calls.
Dataset annotations
Genes
The defined set of rare coding CNVs we detected from ES data were annotated for genic impact based on the following criteria on Gencode v39 annotation. For deletions to impact a gene, we required >10% of the coding sequence (CDS) to be overlapped by the deletion; while for duplications, we required >75% of the CDS to be overlapped by the duplication. This information is encoded in the (genes) field of the VCF. Transcripts were chosen by MANE 0.95, followed by Ensembl-defined canonical transcripts where needed.
Size annotations
The start (POS) and end (END) of these discovered variants were calculated as the median across all processed samples of the consensus intervals spanned by each of the delineated CNV events. In addition to the start, end, and length (SVLEN) variables, for each variant, we also report the number of consensus exons (N_EXN_VAR) and number of consensus intervals (N_INT_VAR) that each variant spans across all processed batches. The consensus number of exons and intervals can be thought of as probe density in microarrays - the higher the number of probes, the greater confidence one has in capturing a true event, and only a true event. Our callset has been filtered to retain only variants that span three or more consensus intervals and consensus exons.
Frequency
Each variant is annotated with site count (SC), site number (SN), and site frequency (SF). SC refers to the number of individuals that carry this variant; SN refers to the number of individuals that have a non-null genotype at this variant; and SF refers to the proportion of individuals carrying this variant, calculated as SC/SN. We further reported each of these statistics calculated on the sample subsets corresponding to defined genetic ancestry groups, with format following xxx_SC, xxx_SN, and xxx_SF for ancestry in {afr, amr, asj, eas, fin, mid, nfe, and sas}.
Data subsets
Due to the known enrichment of large, rare CNVs that confer substantial relative risk in neuropsychiatric phenotypes, we also provide two additional VCFs using a subset of the full releasable dataset. These include a VCF with 418,924 samples that are from participating projects that were not collected for neuropsychiatric conditions (bipolar, epilepsy, schizophrenia, psychosis, and general psychiatric conditions), as well as biobanks, which is referred to as the ‘non-neuro’ subset. The second is a further subset of 269,919 individuals that are either labeled as controls, or are from biobanks, and referred to as ‘non-neuro controls’. All 3 subsets are available from the downloads page.
Limitations of ES-based rare coding CNVs in gnomAD v4
- This dataset includes only rare coding CNVs, filtered to <1% site frequency in the overall dataset.
- This dataset only includes variants that span three or more exons that received sufficient coverage.
- This dataset is limited to autosomal CNVs for now.