We are happy to share, for the first time, local ancestry-informed frequency data for 14,804,207 bi-allelic SNPs within the Latino/Admixed American sample of gnomAD v3.1 (n=7,612). This initial release of gnomAD local ancestry inference (LAI) data contains estimated alternate allele counts, allele numbers, and allele frequencies partitioned by continental ancestries for variants in the Latino/Admixed American population. The samples classified as Latino/Admixed American by gnomAD’s global ancestry inference have highly heterogeneous, admixed ancestry,1 and local ancestry inference resolves these individuals’ admixed ancestry into Amerindigenous, African, and European haplotypes.
Local ancestry-informed frequency data is available for bi-allelic variants with low genotype missingness (i.e., call rate > 0.9) and an allele frequency greater than 0.1% within the Latino/Admixed American gnomAD population. The 7,612 samples contain all samples classified as Latino/Admixed American within gnomAD v3.1 with the exception of samples from the Human Genome Diversity Project, which were used in the local ancestry reference panel for training purposes. We anticipate this finer resolution of allele frequencies will improve the interpretation of variation in individuals with similar genetic ancestries by contextualizing variants to the appropriate continental reference population.
Background
gnomAD’s Latino/Admixed American population is incredibly diverse
Admixed American populations have a complex ancestry makeup resulting from historical admixture events from several continental areas. In the case of Latino populations of the Americas, this admixture is a consequence of the long-distance migration of ancient populations through the Bering Strait from East Asia around 15,000 years ago, European colonization in the Americas (late 15th through 18th century CE), and the transatlantic slave trade from primarily west Africa (16th to 19th century CE), as shown in the map below. The figure also demonstrates two admixture events and what a modern day chromosome from a Latin American individual may look like multiple generations after these events. gnomAD’s global ancestry inference assigns this individual to the Latino/Admixed American population, but we know these demographic histories create extremely diverse mosaic genomes across individuals within this broader population grouping.
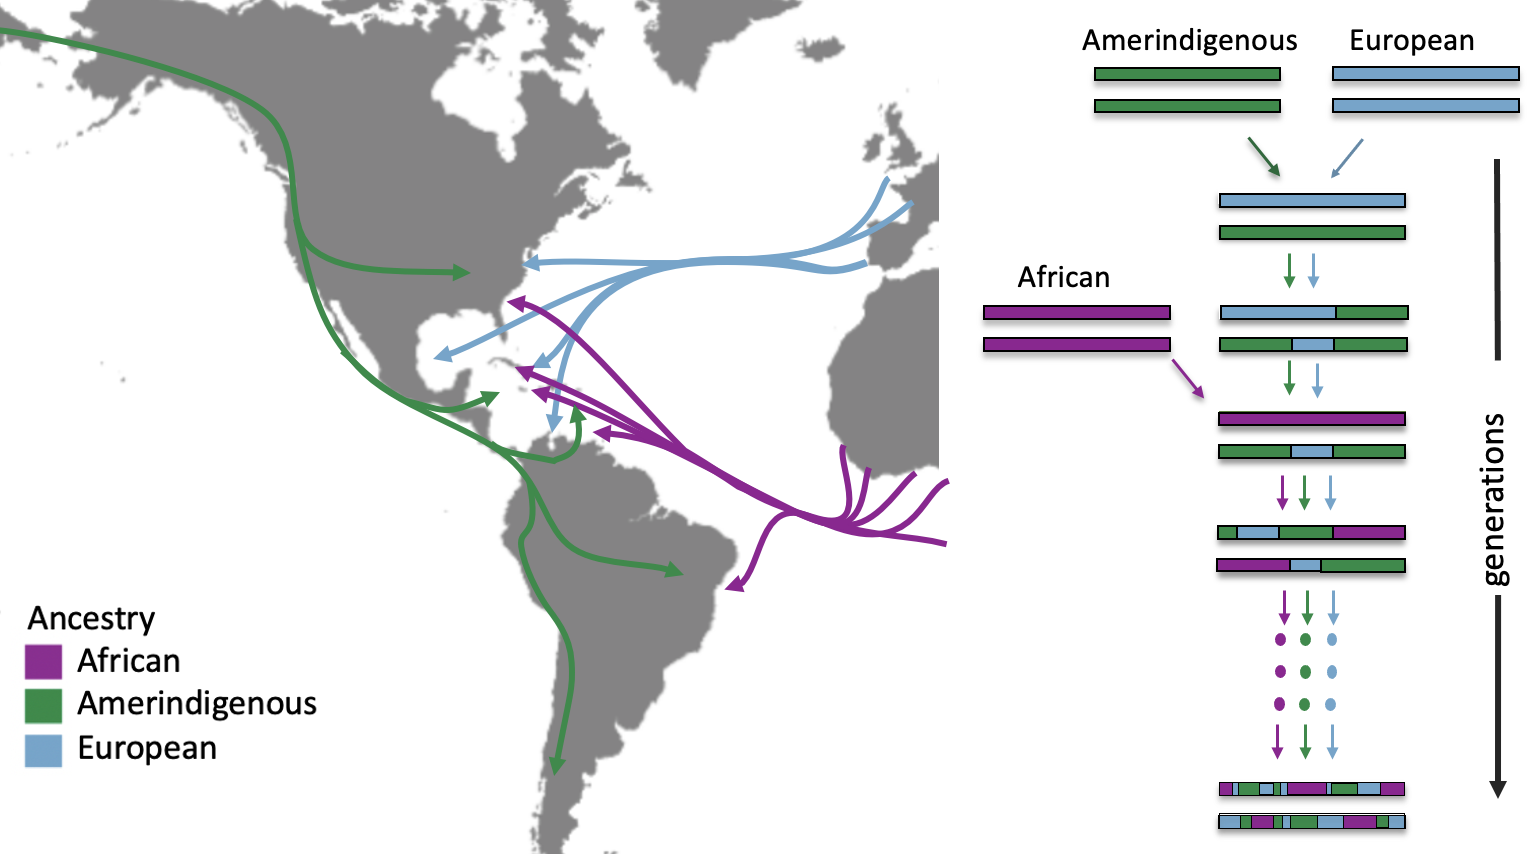
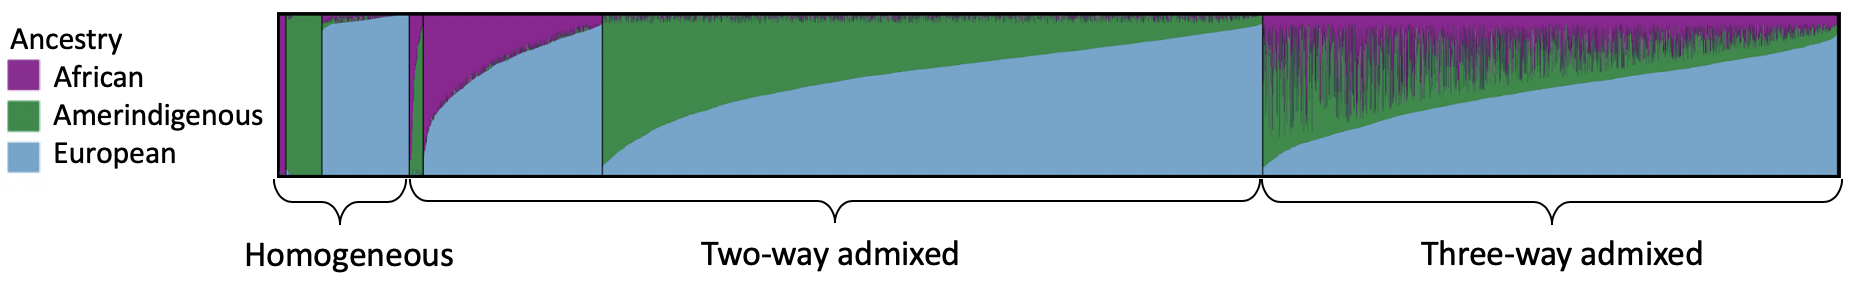
We analyzed the gnomAD Latino/Admixed American global ancestry proportions using the software program ADMIXTURE and a 5% ancestry inclusion threshold. Plotting these results using pong, we saw that the gnomAD Latino/Admixed American population consists of individuals with a wide range of admixture. After applying the 5% ancestry inclusion threshold, 5% of individuals derive their genetic ancestry primarily from a single continental population, 60% from two continental populations, and 35% with three continental populations well-represented within their genome.
This diversity of admixture proportion matters because we know allele frequencies often vary across continental populations. Knowing from which continental ancestry a variant is derived allows us to compute more accurate expected allele frequencies for each continental background separately, instead of aggregating frequencies across admixed individuals regardless of the ancestral origin of the variant’s haplotype. In some cases, updated allele frequencies that take into account local ancestry may differ significantly from their corresponding aggregate allele frequencies, which may impact the clinical interpretation of a variant in an individual.
Local Ancestry Inference
By using local ancestry inference to assign continental ancestry to regional haplotypes, we can determine to which continental ancestry each allele belongs, as depicted in the diagram below.
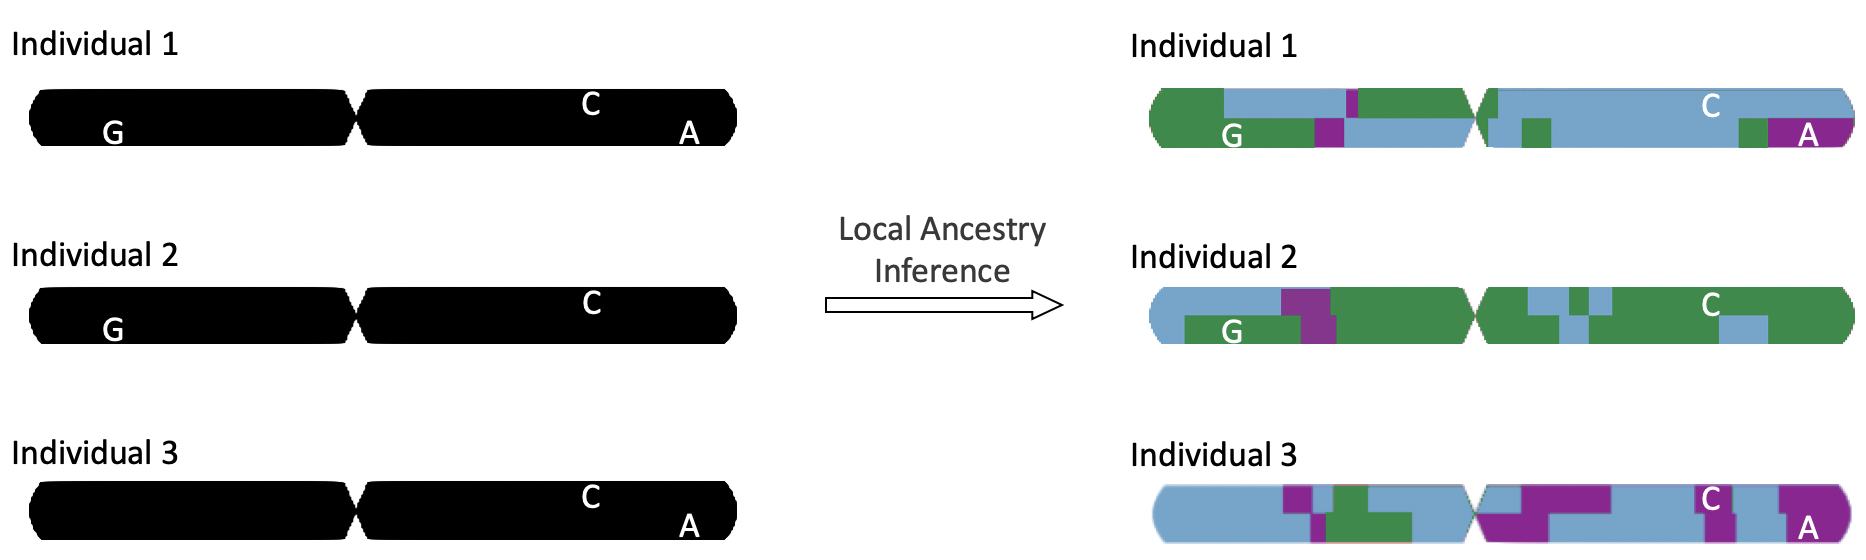
This illustration shows a single chromosome from three individuals, with non-reference alleles at 3 sites of variation (indicated by G, C, and A). After performing local ancestry inference, we can see that Allele G is only found on the green ancestry, Allele A only on the purple ancestry, and Allele C can be found across all three.
LAI pipeline and data generation
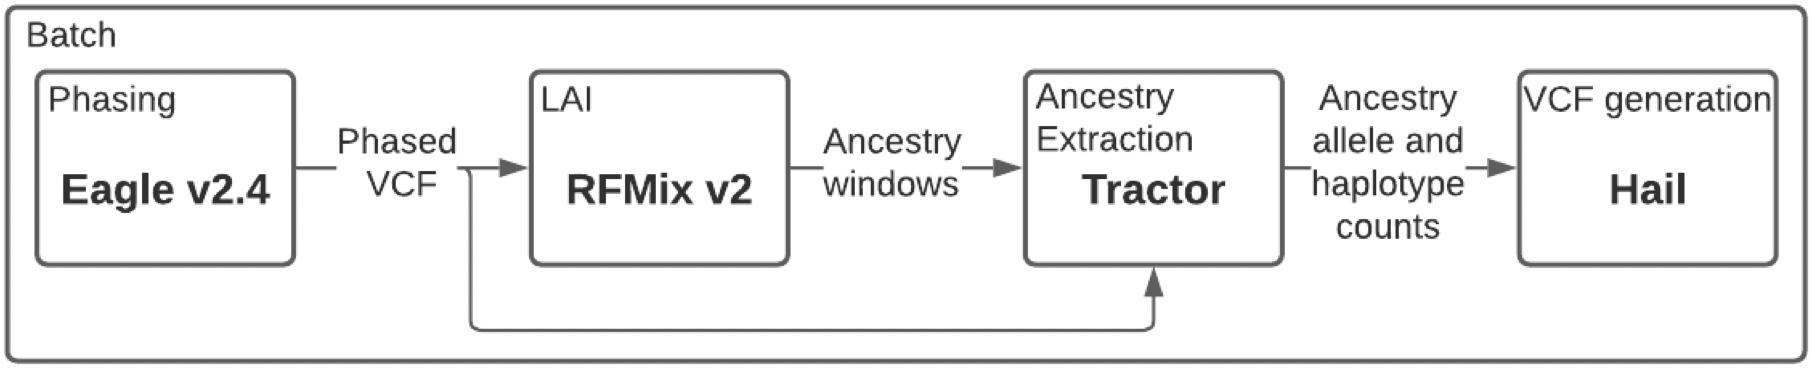
To infer local ancestry data in the gnomAD Latino/Admixed American populations, we built an open-source local ancestry inference pipeline. The figure above shows a schematic of the software pipeline with four major steps: phasing, local ancestry inference, ancestry extraction, and VCF generation. We use Eagle for phasing, as it is the most computationally tractable at this scale. We use RFMix v2 for local ancestry inference, which requires a reference population panel representative of the continental ancestries that are likely to appear within the sample population. Our reference panel was composed of the Human Genome Diversity Project samples from America for the Amerindigenous component, as well as a subset of EUR and AFR samples from the 1000 Genomes Project for the European and African components, respectively. To extract ancestral segments and calculate minor allele dosages, we use the tool Tractor. Finally, we generate VCFs using a Python script that utilizes the Hail library. The entire pipeline is unified using the Hail Batch Python module for scalability.
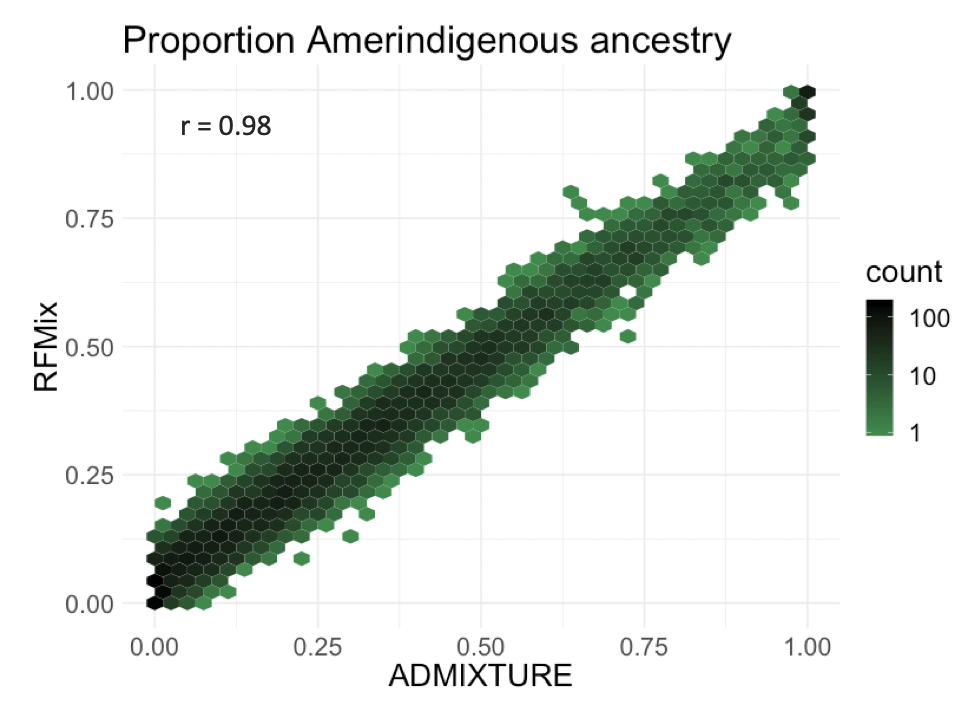
We validated this pipeline by comparing global proportions in the gnomAD Latino/Admixed American population estimated by ADMIXTURE to the results of our LAI pipeline. On the x axis is the proportion of Amerindigenous ancestry in individuals as determined by the tool ADMIXTURE, and on the y axis is the Amerindigenous proportion of ancestry in individuals as determined by RFMix. There is a strong correlation between these proportions (r=0.98), which gives us confidence that our pipeline performs well.
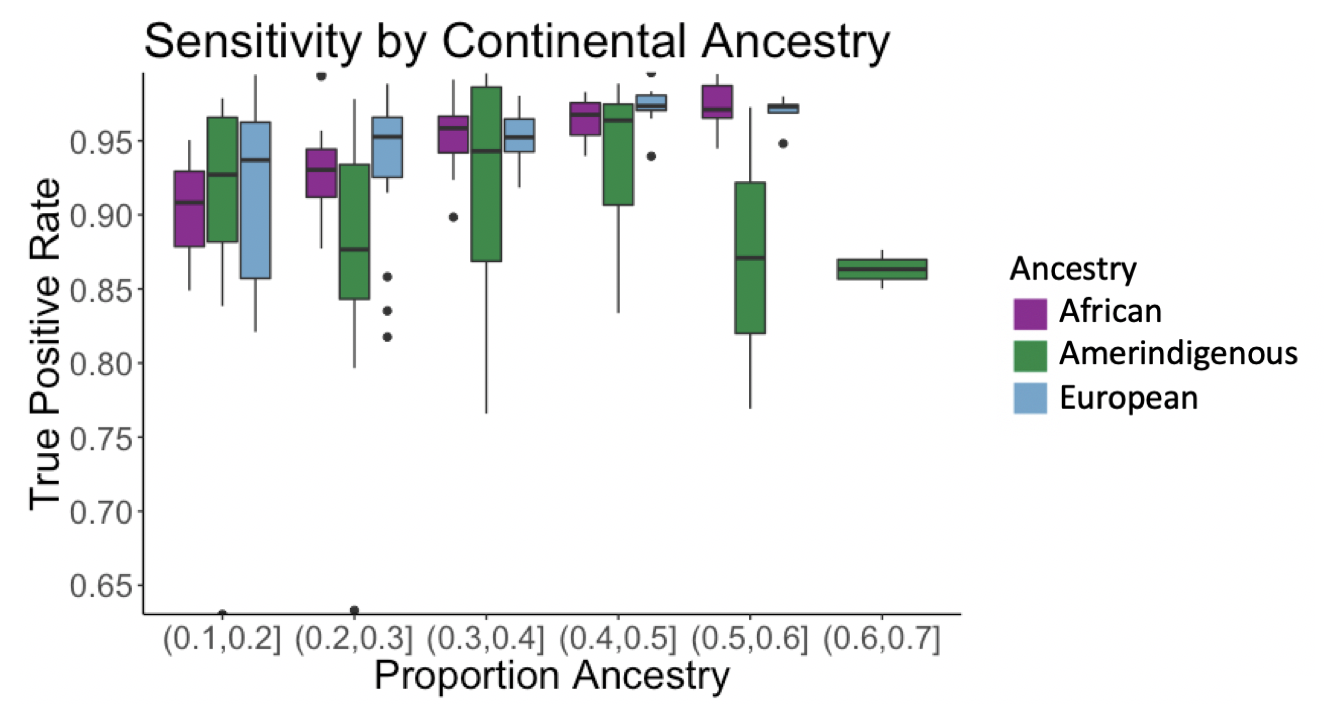
We tested the pipeline’s sensitivity using a simulated admixed American truth dataset. In the plot below, the x axis is binned proportion ancestry while the y axis is the true positive rate. For African and European ancestries, the pipeline’s sensitivity increases from 90 to over 98% as a sample’s ancestry proportion increases; however, we do not see this correlation for the Amerindigenous ancestry, as finding samples to use in the reference panel remains a challenge.
LAI confirms gnomAD’s Latino/Admixed American sample diversity and increases allele frequency resolution
To infer global ancestry in gnomAD, we use the principal components (PCs) computed from hail’s hwe_normalized_pca as features when training a random forest classifier using samples with a known continental origin. We assign a continental population to all samples for which the probability of that continental population is > 90% according to the random forest model. Plotting the first two PCs of the full gnomAD collection, we can see the inferred gnomAD Latino/Admixed Americans span a large portion of global PC space, with some samples clustering closer to European populations, others clustering closer to the African/African American population, and some clustering closer to the East Asian population.
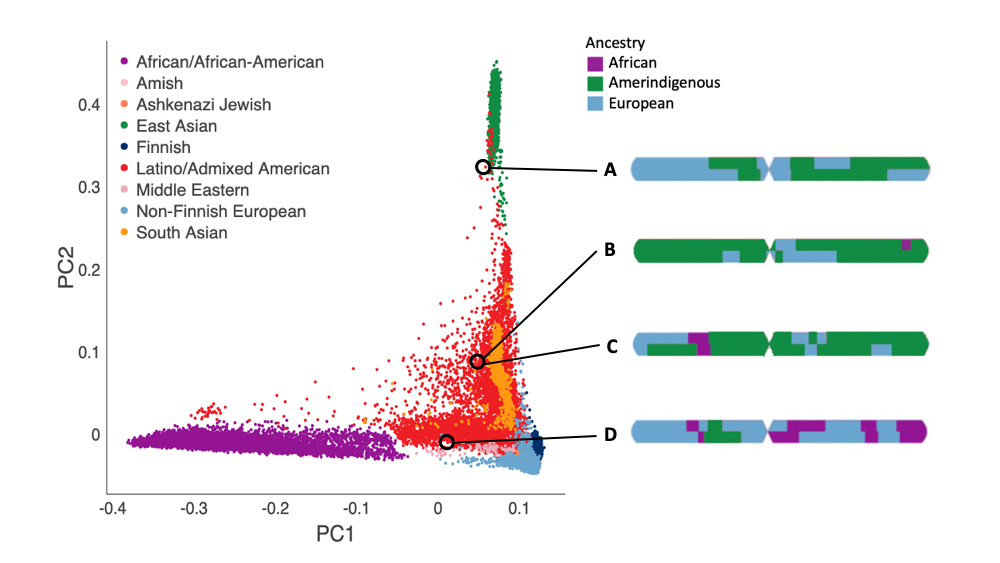
Using local ancestry data, we can now look at the fine-scale ancestry makeup for inferred Latino/Admixed American individuals in different regions of the figure. The figures on the right are painted karyograms of a single chromosome from an individual within each circle. Using the local ancestry data, we can see individual A is two-way admixed: Amerindigenous and European, while individual D is three-way admixed: African, Amerindigenous, and European. Even when we look at two individuals who occupy the same position in PC space, individuals B and C, we can see how different their genetic ancestry actually is at a local level. This underscores the importance of better resolving ancestry in admixed samples, to calculate allele frequency estimates within continental ancestry tracts, which generate more accurate allele frequencies than the aggregate Latino/Admixed American grouping.
Accessing LAI data
To access the local ancestry data for a variant within the browser, select the Local Ancestry tab within the population frequency table on the variant’s page. If local ancestry data is available for the variant, the ancestral allele count (AC), allele number (AN), and allele frequency (AF) estimates will be displayed.
We have also made the gnomAD LAI data available as a VCF. The VCF contains all variants with available LAI data and includes ancestral AC, AN, and AF as well as the variant’s continental allele frequencies for the gnomAD African, East Asian, Non-Finnish European, and the Latino/Admixed American populations.
LAI Data Utility
With this data, we expect to find some disease-relevant variants to occur at elevated frequencies within specific ancestral components because of bottleneck events in a population’s history. An example of this is the gnomAD variant 17-7043011-C-T in the SLC16A11 gene. Variants within this gene have been shown to be a common risk factor for type 2 diabetes in Mexico by the SIGMA consortium.
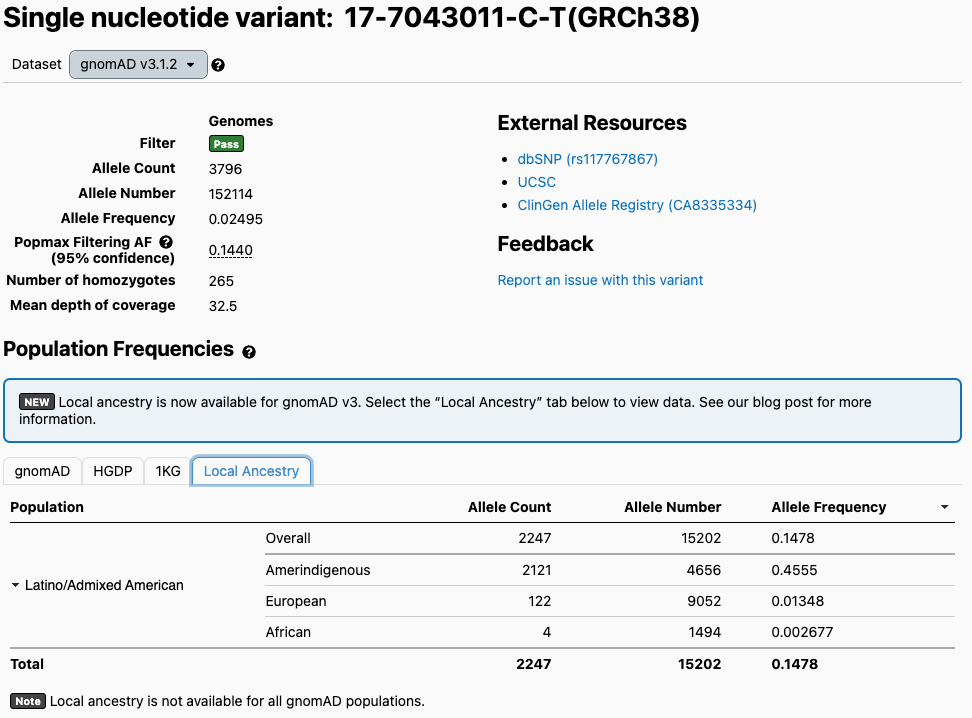
In this table of gnomAD global population allele frequencies, a variant associated with this increased risk of diabetes is elevated within the Latino/Admixed American population at a 14% allele frequency compared to the global gnomAD allele frequency of 2%. Viewing the local ancestry data for the Latino/Admixed American population, we can see that the variant actually occurs at a 45% allele frequency in Amerindigenous regions and closer to 0% in the African and European regions, highlighting that the elevated frequency is driven by one ancestral component.
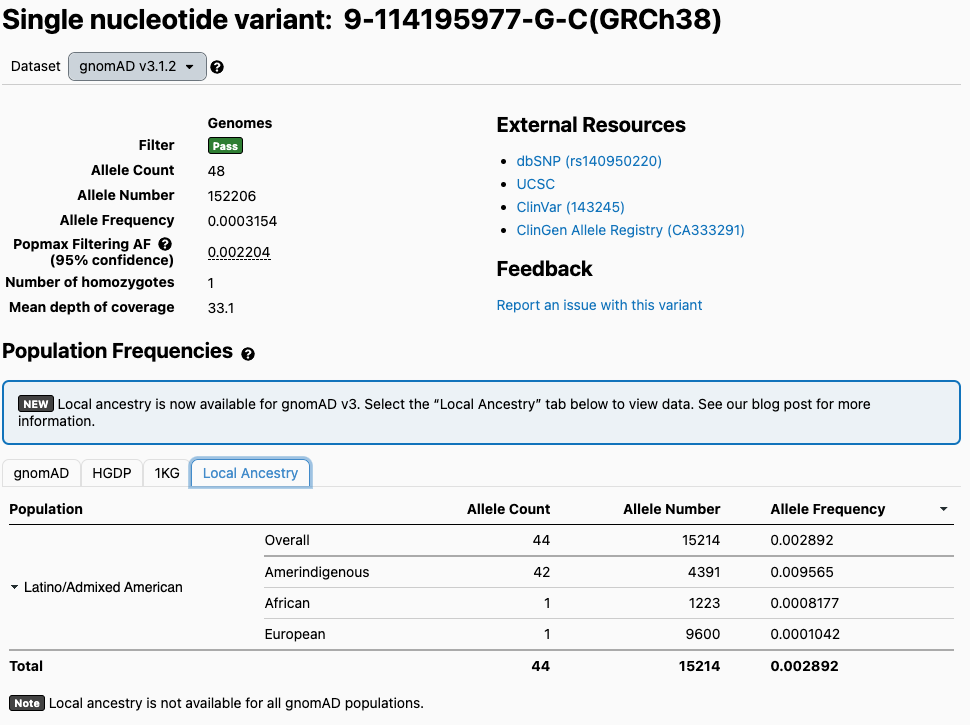
Local ancestry inference is useful in resolving allele frequencies for rare variants as well as common variants. A variant in the COL27A1 gene has been shown to cause Steel syndrome and suggests a founder mutation effect in the Puerto Rican population. This causal variant has 0.3% allele frequency within the Latino/Admixed American population while gnomAD’s global allele frequency is 0.03%. Separating this variant’s gnomAD Latino/Admixed American frequency into LAI allele frequency estimates, we see that the variant occurs at ~1% allele frequency in Amerindigenous regions and closer to 0% in African and European regions, reinforcing this founder effect hypothesis and again showing the usefulness of refined local ancestry-informed frequencies in large genomic datasets.
Conclusion
Local ancestry inference in admixed individuals provides higher resolution and more accurate allele frequencies for each continental ancestry. This release of local ancestry-informed frequency data is currently available for the Latino/Admixed American sample. We plan to continue this effort for the African/African American sample within gnomAD in the near future. We hope this data can be used to enhance the scientific community’s ability to understand the origin of human variation as well as clinically interpret variation and better identify those populations at highest risk for certain diseases.
Acknowledgments
We thank Mark Daly and Heidi Rehm for gnomAD leadership; Konrad Karczewski and Alicia Martin for analysis suggestions and general guidance; Alicia Byrne for literature review; Jackie Goldstein, Dan King, and Ben Weisburd for pipeline scalability assistance; Marcos Santoro and Jessica Mauer for providing the simulated dataset and LAI reference panel guidance; Katherine Chao and Julia Goodrich for pipeline code review; Nick Watts for incorporating LAI data in the browser.
- “Ancestry” is a statistical construct based on the genetic variants that an individual inherited from their ancestors. “Race” and “ethnicity” are social constructs and group people based instead on perceived physical, geographical, cultural, or other social characteristics. In all analyses presented here, we exclusively refer to genetic ancestry. Assignment of an individual’s genetic ancestry is not equivalent to and does not negate how an individual self-identifies.↩