This minor update to the gnomAD TR pages includes:
-
Added one more TR locus: RAI1, so there’s now data for 78 total TR loci. Also added pathogenic thresholds for three loci that already had TR data but previously lacked a disease association: AFF3 (GCC x 300), CBL (CGG x 101), and ZNF713 (GCG x 450), taken from STRchive v2.24.2.
-
Updated pathogenic thresholds for the following loci. These changes are primarily based on syncing thresholds with STRchive v2.24.2, while taking into account some differences in how loci are defined in gnomAD vs. STRchive (for example, RUNX2 has a reference region that’s narrower by three trinucleotide repeats in gnomAD compared to STRchive, so the pathogenic threshold is also reduced by three repeats in gnomAD):
-
Updated normal thresholds for the following loci (also based on STRchive v2.24.2):
-
Added genotype quality scores based on manual review of the shortest alleles at PRE-MIR7-2, since contracted alleles (TTTG x 3 repeats) at this locus are pathogenic. Unsurprisingly, all 33 alleles called as having three repeats are clear genotyping errors:

Thanks to Helmut Grasberger for flagging this issue.
This is an example read visualization from the PRE-MIR7-2 page showing how the 3 x TTTG allele actually has a 4th TTTG repeat that is mislabeled as a single nucleotide variant:

-
The EP400 locus definition was reverted from a wide region (29 x CAG repeats @ 12:132062524-132062611) to the original narrower region (21 x CAG repeats @ 12:132062548-132062611) for consistency with the TRExplorer v1 catalog [Weisburd, Dolzhenko et al. 2026] and the Illumina / DRAGEN 174k catalog. Although narrower, purer locus definitions often yield higher-quality ExpansionHunter genotypes, the EP400 locus is an exception, where the narrower definition causes ExpansionHunter to produce more low-quality overestimated allele sizes. This reduction in genotype quality is reflected in the updated manual-review genotype quality scores on the EP400 page:
Before (wider locus definition from the March 2025 release):

After (narrower locus definition in this release):

The following scatter plot directly compares large allele sizes called by ExpansionHunter when using the wider definition (y-axis) vs. the narrower definition (x-axis). Each dot represents a gnomAD sample, and the dot color & shape represent genotype quality based on manual review:
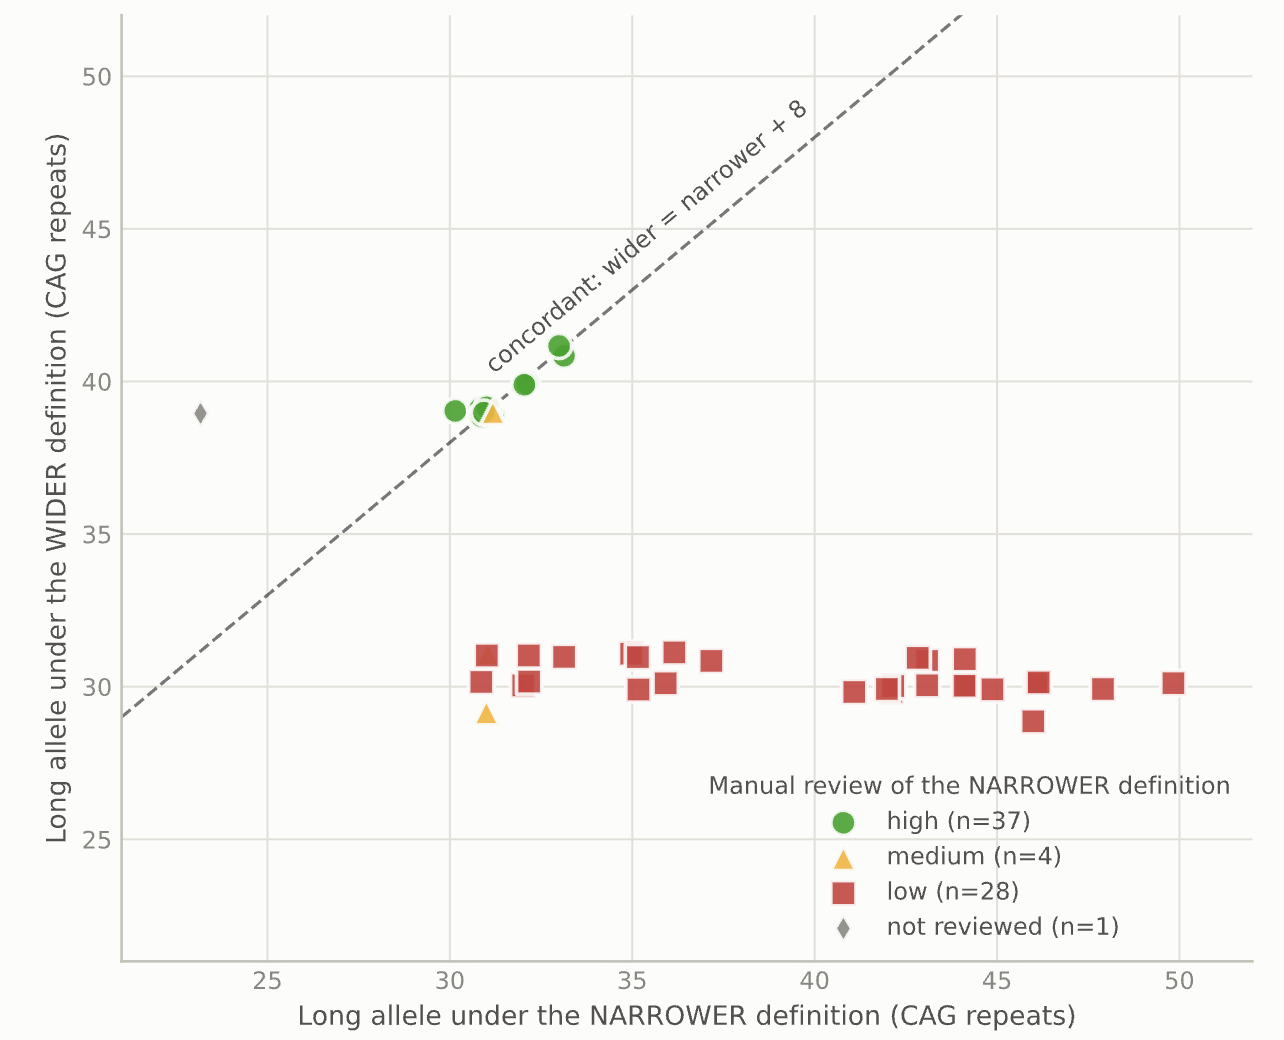
In this release, we decided to prioritize consistency with other resources over genotype quality for this locus, but will aim to give users the option to view results for either locus definition in a future update.
As a final illustration of how the two slightly different ways of defining this locus lead to very different genotype qualities, the following two REViewer read visualizations were generated from the same sample (the right-most dot in the scatterplot) - using the wider definition:

vs. the narrow definition:

Site Updates
- Added a data-version label to the TR pages.