Overview
Today we announce the release of a new tool, the Genetic Prevalence Estimator (GeniE, https://genie.broadinstitute.org), which uses gnomAD allele frequencies to estimate the genetic prevalence of autosomal recessive diseases. This tool was developed in partnership with the Chan Zuckerberg Initiative Rare as One Network. By removing the need for computational expertise, GeniE makes estimating the genetic prevalence of rare recessive disease more accessible to the entire genomics community.
Key GeniE features:
- Simplifies creating genetic prevalence estimates by automating the process of compiling disease-causing variants (ClinVar) with allele frequency data (gnomAD)
- Offers multiple standardized methods for calculating carrier frequency and genetic prevalence
- Improves transparency by clearly displaying data sources, methods used, variant details, and allele frequencies used for the estimates
- Allows users to share these genetic prevalence estimates either privately with other GeniE users or publicly through the GeniE dashboard
Background
Although there are over 10,000 rare diseases and it’s estimated that 1 in 10 individuals is affected by a rare disease1, the true prevalence of most rare diseases is still unknown. Traditional methods for estimating numbers of individuals with a rare disease, such as counting cases of known affected individuals in medical records, can yield biased and inaccurate estimates. Additionally, newborn screening is only available for a small number of conditions and is incompletely implemented in many countries. Given these limitations, genetic prevalence, defined as the estimated proportion of a population that has a causal genotype for a genetic disorder, has become an increasingly popular way of estimating the number of affected individuals in the population.2,3
To date, the vast majority of genetic prevalence estimates are performed at a point in time and the results are static, using the variants and allele frequencies available at the time of publication. But the underlying data for these estimates, known disease-causing variation and population allele frequencies, are dynamic and continue to be updated. Current approaches to bioinformatically solve these challenges4 include pipelines that 1) require individuals to have advanced computational skills in order to use the tools, and 2) rely heavily on database-specific annotations to produce the estimates. To keep up with the evolving nature of this data while also improving both the accessibility and transparency of these estimates, we designed GeniE, the genetic prevalence estimator.
How to use GeniE
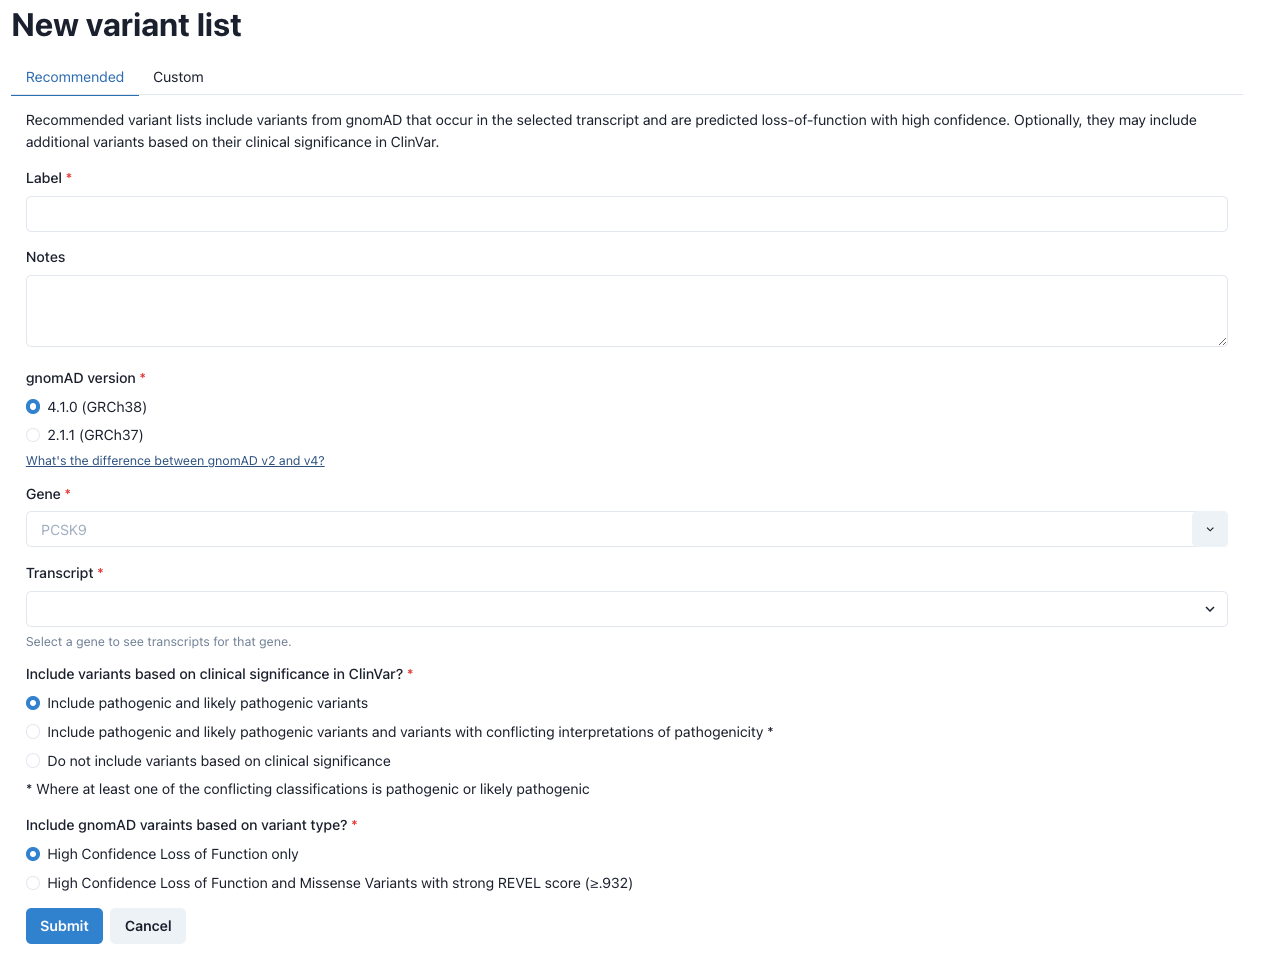
Creating new variant lists Carrier frequencies and genetic prevalence estimates are built upon the variants included in the analysis. Thus, it is imperative to be both inclusive and specific for disease-causing variants. To aid in the process of gathering variants, GeniE offers users two options for creating variant lists: recommended and manual.
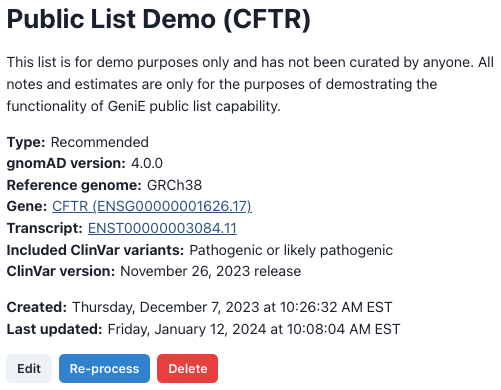
Results page As previously mentioned, the underlying variant data for these estimates are dynamic and can change over time, so all results pages will first list the relevant details on how and when the estimates were created (fig 2).
Below the list creation details are the options for sharing this list with other GeniE users or with the general public (fig 3). Owners are able to give other users tiered access to the list or make a list public (upon review by GeniE staff). Public lists are viewable by anyone, even non-GeniE users. To learn more about the levels of access and public lists, please see our FAQ.

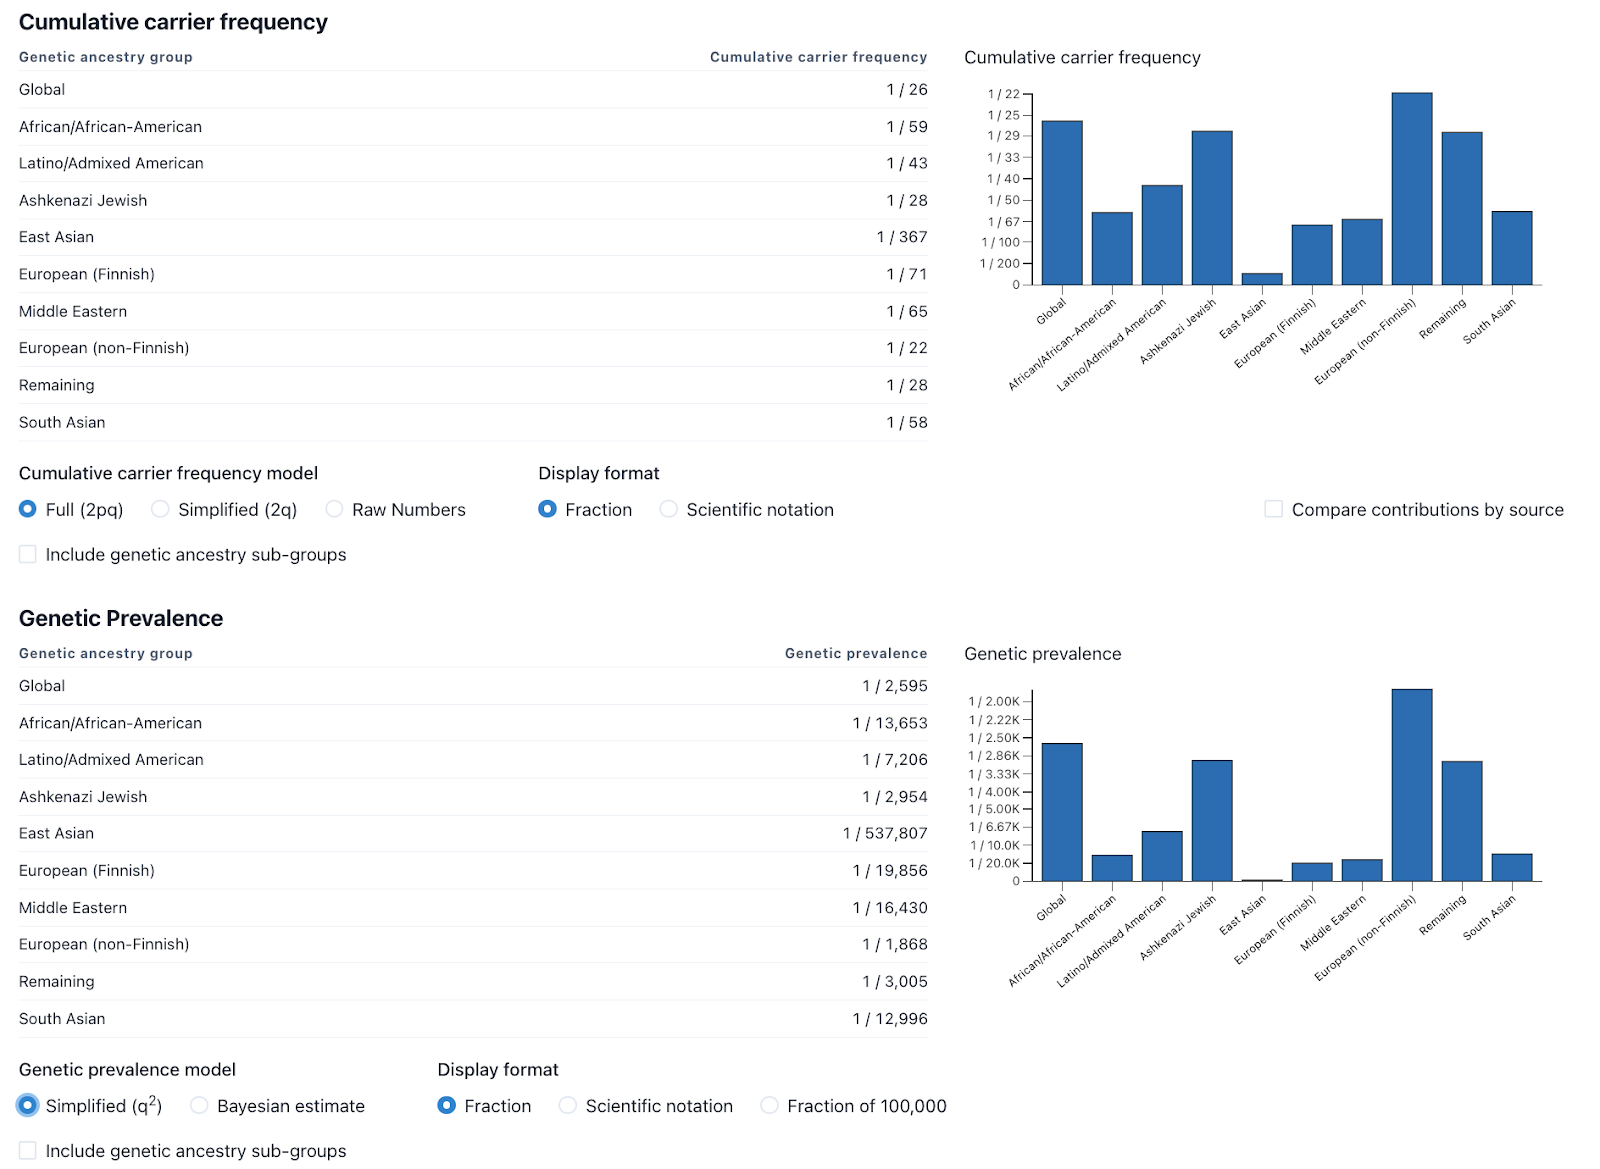
While one of the goals of GeniE is to standardize the methods used for estimating carrier frequency and genetic prevalence, we also recognize that different methods may be more useful in certain scenarios. For that reason, we provide a variety of methodologies that the user can easily change via radial buttons below the charts (fig 4). To learn more about the various method selections and display options, read our FAQ.
While previously described methods have included confidence intervals (CIs) for these types of analyses5, the methods for these CIs only take into account the size of the genetic ancestry group and not the many other factors that have influence on the results. We decided that putting confidence intervals on these numbers would overemphasize one factor and ignore the many other unknowns including but not limited to clinical sensitivity, impact to life expectancy, and disease penetrance. We are looking into potential ways of building confidence intervals that take more of these factors into account and will add those to a future version of GeniE, if deemed useful. Learn more about the various factors that should be considered when interpreting genetic prevalence results.
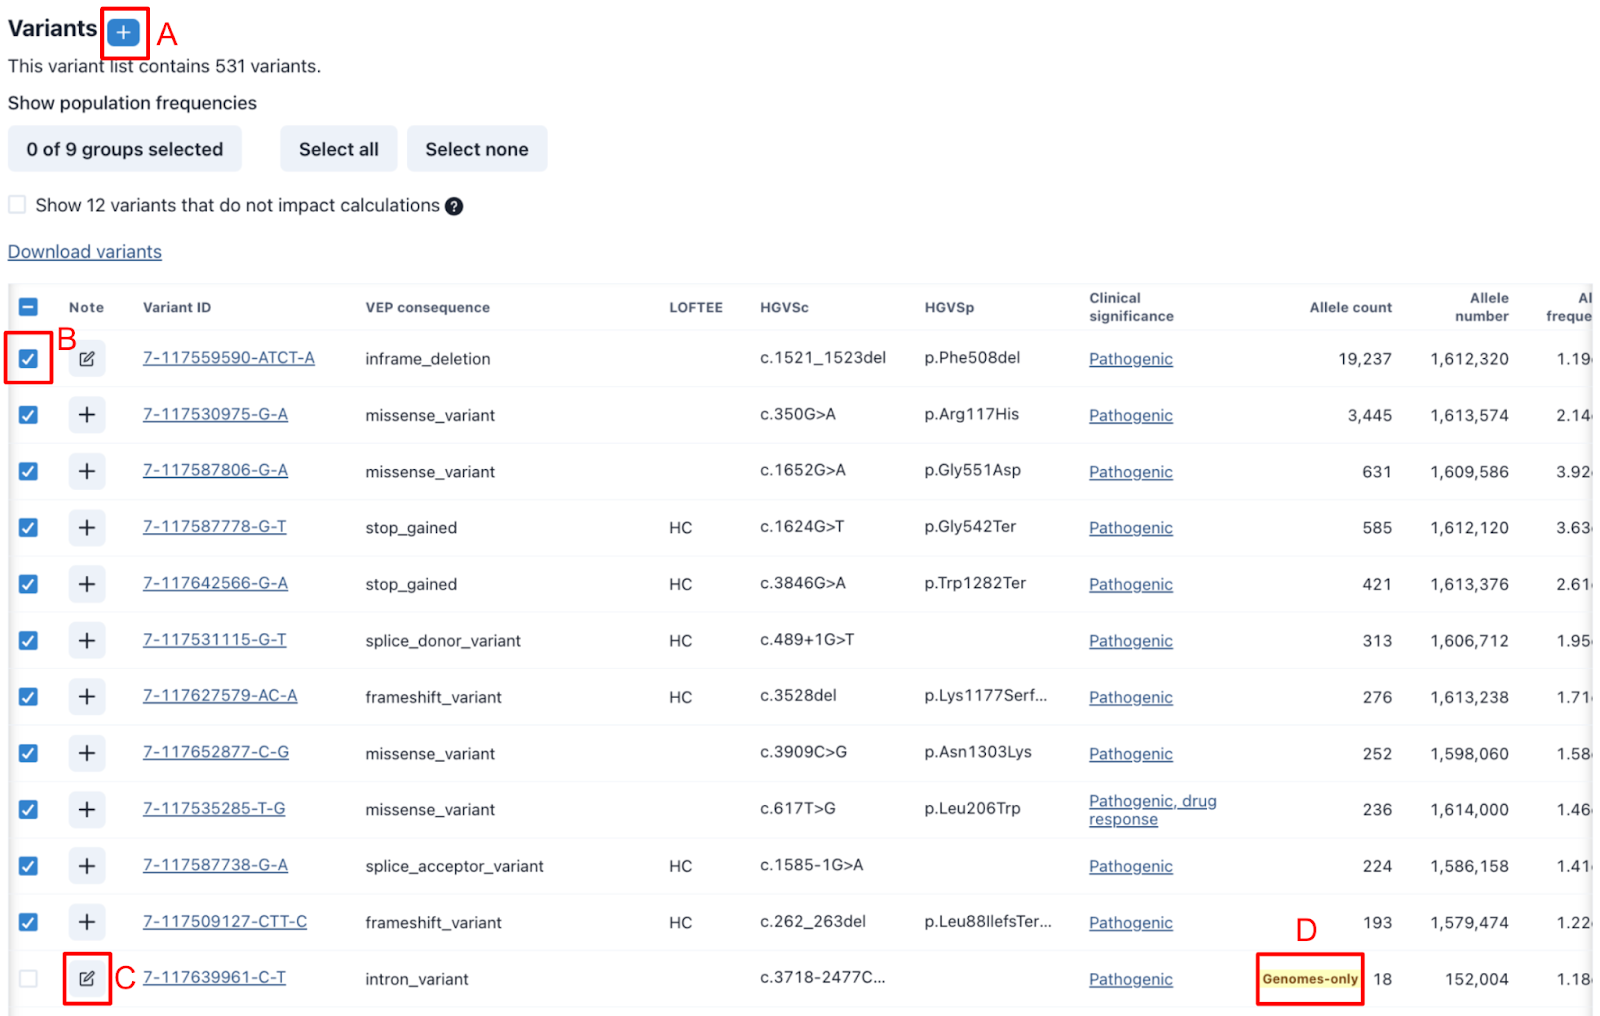
All variants included in the list are displayed below the results in the variant table. The table includes the gnomAD variant ID, relevant metadata, and links to our primary sources, gnomAD and ClinVar. Not all variants included in the initial list will always be appropriate for use in the estimates. GeniE helps facilitate this curation process by allowing for quick review of key data, providing places to share notes, and flagging variants that may require additional review (fig 5). Common reasons for exclusion include lack of evidence to support pathogenicity, low gnomAD allele numbers (ANs) typically due to poor coverage resulting in an artificially increased allele frequency, and a predicted damaging variant not yet seen in patients with a higher allele frequency (AF) than the more common well-established (likely) pathogenic variants.
The table defaults to include global allele count (AC), allele number (AN), and allele frequency (AF) but can also be configured to include these details for other genetic ancestry groups. All columns are sortable and any changes to columns are saved for future reference. All variant details can be downloaded as a TSV file, allowing people to apply their own methods if desired.
Dashboard
The GeniE dashboard both acts as a lookup tool for preliminary estimated genetic prevalence as well as a landing page to display public GeniE lists, including any supporting documents provided by the GeniE list owner. Orphanet prevalence estimates are also imported through their release files.
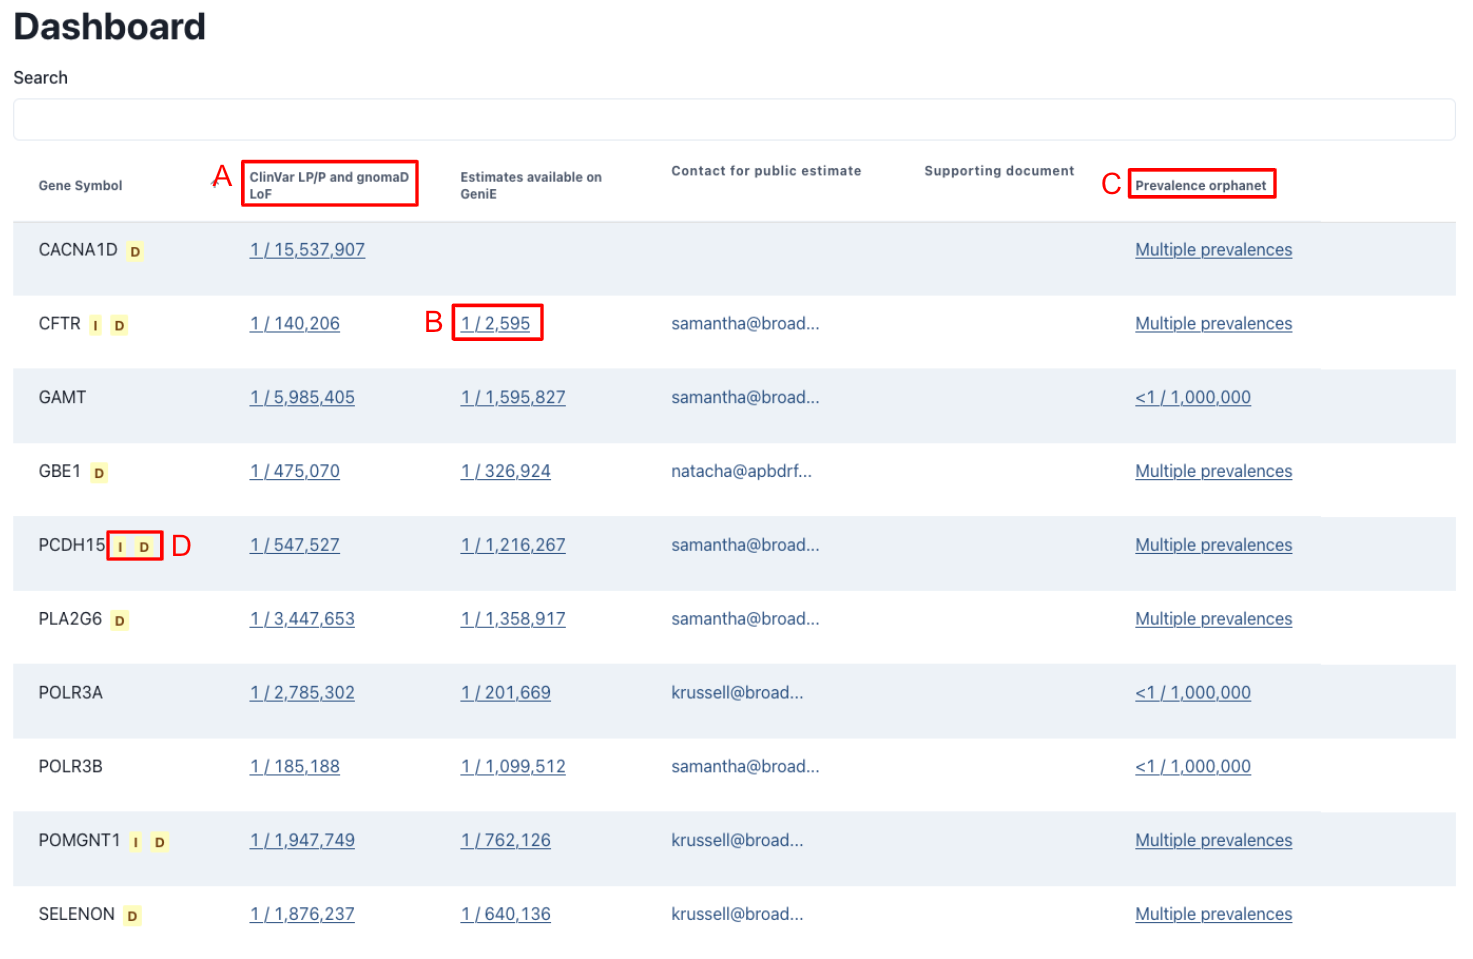
The preliminary estimated genetic prevalence is calculated similarly to the default setting for GeniE Variant lists, using gnomAD v4 frequencies for ClinVar pathogenic and likely pathogenic (LP/P) as well as high confidence loss of function variants from gnomAD. Unlike the public lists, these lists have not been manually reviewed and could contain non-disease causing variants, which meet the previously listed criteria. As such these estimates should be used with caution. For a more information about the various factors that should be considered when interpreting genetic prevalence results, read our FAQ.
A view only display of all results is available by clicking on the estimated results. For the publicly shared GeniE lists, all variants included in the estimate are displayed; however, for the ClinVar LP/P and gnomAD estimates, only the 10 variants with the highest allele frequency are displayed. Users who would like to do a deeper analysis on a gene are encouraged to create their own list.
Currently, only one public list can be shared per gene. If you have questions or concerns about a public list, we encourage users to reach out to the owner of the public list to share input and collaborate on the estimates.
Conclusion
We believe that GeniE will make genetic prevalence a more accessible and transparent process. Development of this tool was strengthened by the large community of collaborators that were willing to provide input and feedback, including patient advocacy groups.
Limitations
No population database, including gnomAD, is representative of the entire human population. We expect future releases of gnomAD to increase representation of diverse genetic ancestry groups; however, this is an area that will continue to need to be addressed and more diversity of reference data is needed. Similarly, not all pathogenic variation is included in ClinVar and gnomAD, especially variation from underrepresented groups and for more recently discovered gene-disease relationships.
Currently, variants that are not found in gnomAD cannot be included in this analysis due to the absence of population frequencies.
GeniE currently only supports sequence variants and structural variants. Other variation, which contributes to disease, will not be included in this analysis.
The Hardy-Weinberg principle assumes random mating and does not take into account the increased rates of consanguinity in some cultures which increases the prevalence of recessive conditions in these regions due to increased homozygosity rates.
Future Directions
We plan to continue to add new features to GeniE, including but not limited to: supporting multiple inheritance patterns, displaying the count of variants contributing to the carrier frequency of each genetic ancestry group, creating a “removed variants” table, and allowing for multiple estimates to be added together. If you have any feature requests please email prev-genie@broadinstitute.org or file an issue via GitHub.
Right now GeniE is designed to estimate the genetic prevalence of autosomal recessive diseases. However, we plan to include autosomal dominant disease in the near future. Some methods have been developed for estimating the genetic frequency of autosomal dominant conditions.6,7 Our team intends to adapt these methods, along with some modifications to address the gene-specific considerations needed to support autosomal dominant conditions.
While some past studies have attempted to use this method to estimate X-linked recessive diseases, this can lead to underestimating the genetic prevalence. This is likely due to a combination of factors including: 1) Not taking into account the 1/3 de novo rate in X-linked disease, 2) Female carriers of X-linked rare diseases, who may have milder disease manifestations, may be less likely to participate in or meet recruitment criteria for research studies that are included in gnomAD, leading to a depletion of symptomatic carriers, which could lower the allele frequencies of pathogenic variants observed in gnomAD. While inclusion of more biobanks could improve the latter issue, there is still more work to be done to improve the quality of genetic prevalence estimates for X-linked conditions.
Technical Details
GeniE uses the gnomAD release Hail tables as the primary source for frequency information for short variants and structural variants. ClinVar data, in the form of classification of variants and their star rating, comes from ClinVar’s regularly released VCF files. To populate the list of possible transcripts to use for a given gene when creating a list, GeniE leverages gnomAD’s GraphQL API.
GeniE’s frontend is built in React, it uses TypeScript for static typing, and Chakra-UI for modular UI components. GeniE’s backend is built in Python, using DjangoRest. The Python worker that processes dashboard lists receives messages through Google Cloud PubSub, and creates a new list from the input tables using Hail.
Infrastructure is managed by Terraform, and it is deployed in Google Cloud Run, using Google Cloud Build.
The source code necessary to reproduce the analyses is available on GitHub.
Acknowledgments and Contact Information
Thank you to all the patient-led organizations who helped in the development of this tool, including but not limited to APBD Research Foundation, Association for Creatine Deficiencies, Congenital hyperinsulinism international, Cure AP-4, Cure CMD, Cure CMT4J, DADA2 Foundation, Hermansky Pudlak Syndrome Network, INADcure Foundation, TANGO2 Research Foundation, TESS Research Foundation, The Yaya Foundation for 4H Leukodystrophy, and Usher 1F Collaborative. This tool would not be possible without their support, insights, feedback and collaboration. We are so lucky to have you all as scientific collaborators on this project.
Thank you to the gnomAD production team, especially Mike Wilson for their help with this project. Thank you to Moriel Singer-Berk, Katie Russell, Carmen Glaze, Steve Schrodi, and Eric Minikel for their unwavering support and open feedback.
We would like to acknowledge the Chan Zuckerberg Initiative Donor-Advised Fund at the Silicon Valley Community Foundation for supporting development of this tool (funder DOI 10.13039/100014989; 2022-316726; https://doi.org/10.37921/236582yuakxy). A special thanks to the CZI Science in Society and Rare as One team, Tania Simoncelli, Heidi Bjornson-Pennell, Andra Stratton and Maddy Pensiero, who have believed in this tool from the very beginning.
Questions about the work described in this post may be directed to samantha@broadinstitute.org.
References
- https://ncats.nih.gov/research/our-impact/our-impact-rare-disease
- Schrodi S., et al “Prevalence estimation for monogenic autosomal recessive diseases using population-based genetic data” Hum Genet. 2015 Jun;134(6):659-69. doi: 10.1007/s00439-015-1551-8. Epub 2015 Apr 19.
- https://www.cureffi.org/2019/06/05/using-genetic-data-to-estimate-disease-prevalence/
- Guo M., et al “Estimating yields of prenatal carrier screening and implications for design of expanded carrier screening panels” Genet Med. 2019 Sep;21(9):1940-1947. doi: 10.1038/s41436-019-0472-7. Epub 2019 Mar 8.
- Lake N., et al “Estimating the Prevalence of LAMA2 Congenital Muscular Dystrophy using Population Genetic Databases” J Neuromuscul Dis. 2023;10(3):381-387. doi: 10.3233/JND-221552.
- López-Rivera, JA., et al “A catalogue of new incidence estimates of monogenic neurodevelopmental disorders caused by de novo variants” Brain. 2020 Apr 1;143(4):1099-1105. doi: 10.1093/brain/awaa051.
- Gillentine MA., et al “Estimating the Prevalence of De Novo Monogenic Neurodevelopmental Disorders from Large Cohort Studies” Biomedicines. 2022 Nov 9;10(11):2865. doi: 10.3390/biomedicines10112865.